US CoreLogic S&P Case-Shiller Index Posts a Small Gain in March, Up 0.7% From Last Year

However, monthly gains suggest that homes prices are heating up again
Home price growth in early spring 2023 proved stronger than initially anticipated, reflecting a major imbalance in the housing market. While eager homebuyers jumped in as soon as mortgage rates retreated from their 7% highs, this market dynamic was not met with same enthusiasm from sellers.
As a result, the already tight inventory of existing homes for sale shrank further and thus did not offer the usual spring homebuying season boost. The pressure on home prices reflected in monthly gains illustrates not only buyers’ responsiveness to movements in mortgage rates and pent-up demand due to demographic fundamentals, but also delayed demand from those that were unable to buy in the very competitive housing market during the pandemic.
In March, the CoreLogic S&P Case-Shiller Index squeezed out a 0.7% year-over-year increase, down from a 2% gain in February, marking the 11th straight month of decelerating annual home price gains. With the sharp decline in home price growth over past the year, March’s annual gain was the slowest since the summer of 2012 (Figure 1).
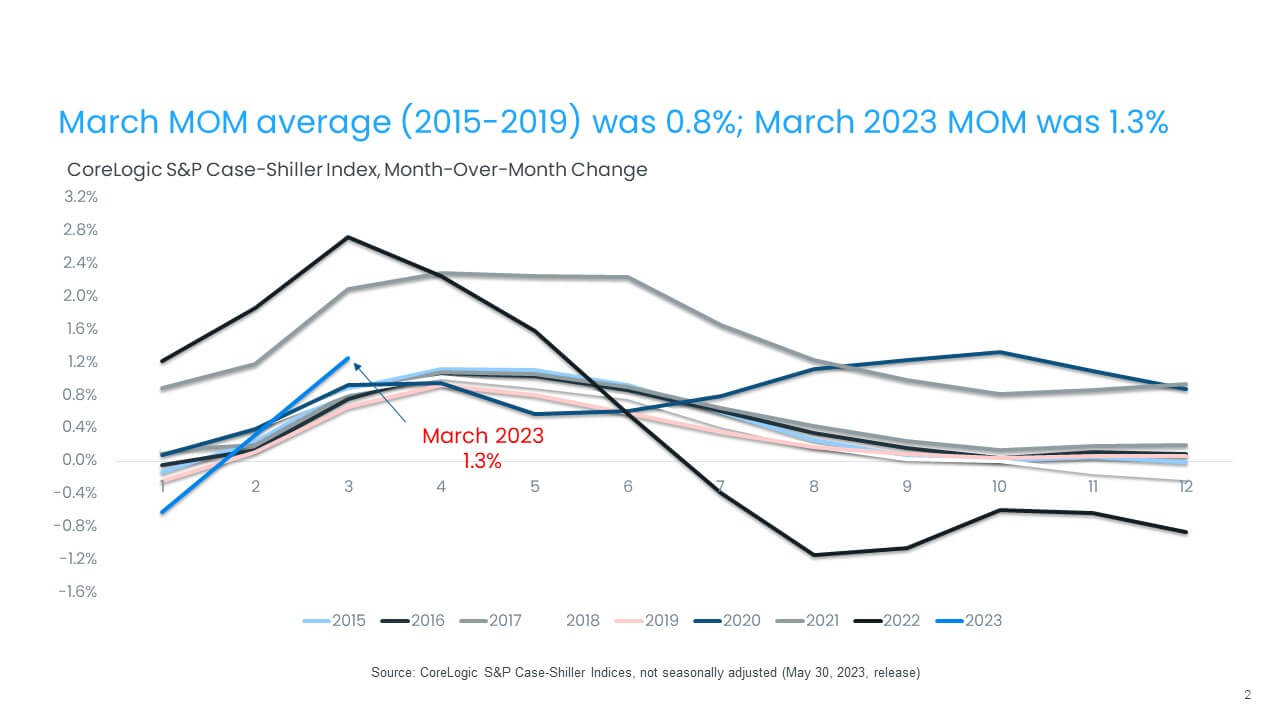
But the non-seasonally adjusted month-to-month index posted a strong gain, up by 1.3% in March from a 0.3% increase in February. Between 2015 and 2019, the monthly index changes from February and March have generally averaged 0.8% (Figure 2).
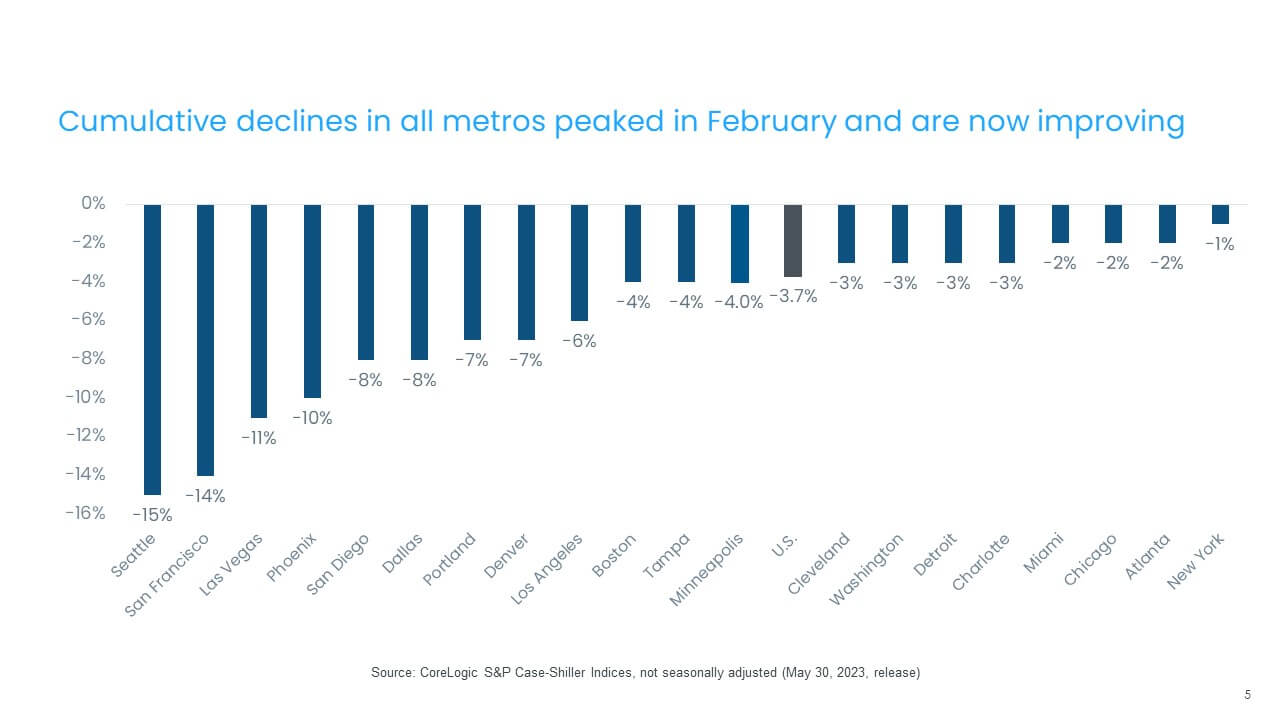
Cumulatively, home prices in the national index are down by 3.7% from 2022’s high point, an improvement from the 5% cumulative decline recorded last month. In most markets, home prices bottomed out in January and February and are now showing gains. Still, cumulative declines in some markets remain in double digits.
Seattle tops that list, with a 15% cumulative decline since the peak, down from a 17% decrease last month. New York had the nation’s lowest decline of 1%, while Miami, Atlanta and Chicago experienced only about 2% losses. The recent strength in monthly price gains is evident even in the county’s weakest markets, suggesting that the extent of cumulative price declines in those metros may have reached their peaks. Also, as a result of stronger early spring appreciation, the latest CoreLogic’s latest Home Price Index suggests that home prices nationally are expected to average a 4% increase in 2023 compared with the previous year.
Looking at annual changes, the 10- and 20-city composite indexes followed the same decelerating year-over-year trend in March — both down by about 1%. For both composites, these were the slowest increases since 2012. Over the previous month, The 10-city index was up by 1.6%, while the 20-city index increased by 1.5%. The 10-city index includes currently better-performing metros, such as New York and Chicago, which have seen relatively stronger housing market performance since mid-2022, as the return to cities and offices has gotten underway.
Compared with the 2006 peak, the 10-city composite price index is now 39% higher, while the 20-city composite is up by 46%. Adjusted for inflation, which continues to remain concerningly elevated, the 10-city index is now down by 3%, while the 20-city index showed an 2% increase compared with its 2006 high point.
Figure 1: March Home Price Gains Were the Slowest Since May 2012
© 2023 CoreLogic,Inc., All rights reserved.
Figure 2: Month-to-Month Prices Increases Exceed Average in March
© 2023 CoreLogic,Inc., All rights reserved.
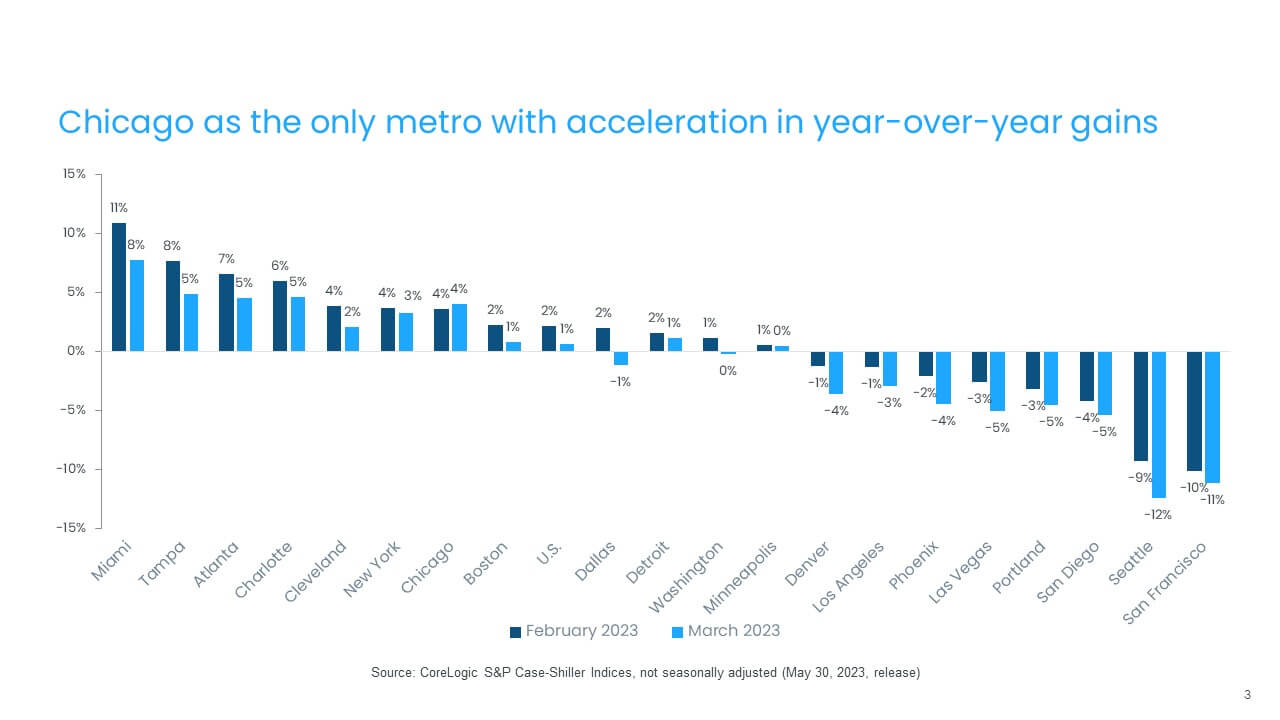
In March, all but one metro, Chicago, continued to experience decelerating annual gains (Figure 3). Miami ranked No. 1 with a 7.7% annual increase in March, but that is down from February’s non-seasonally adjusted rate of 10.9%. Tampa, Florida again ranked second, recording a 4.8% year-over-year gain in March, down from 7.7% in February.
Charlotte, North Carolina posted the third-highest increase, at 4.7%, while Atlanta saw a 4.5% gain. San Francisco and Seattle both continued to post annual declines, down by a respective 11.2% and 12.4% in March.
Compared with the previous month, all metros posted increases in March. San Francisco and San Diego posted the nation’s largest monthly gains, 3% and 2% respectively, while Phoenix, Las Vegas, Cleveland and Miami showed the smallest gains of less than 1%. Still, these gains are in line with seasonal increases that are historically recorded between February and March.
Figure 3: Annual Slowdown in Home Prices Continues Across Metros
© 2023 CoreLogic,Inc., All rights reserved.
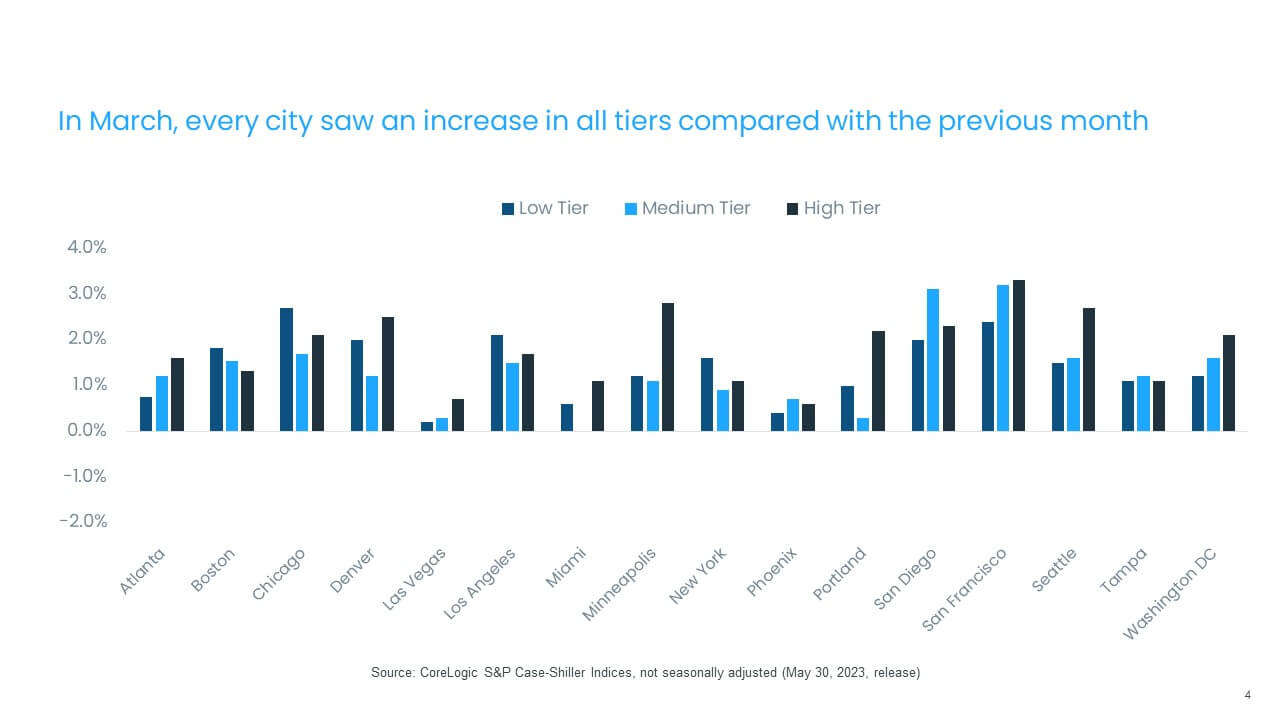
The month-over-month comparison of appreciation by price tier and location also reveals relative changes in demand across the country. In March, all areas posted increases across price tiers. West Coast markets where price declines have been the largest to date led the gains, including San Francisco and San Diego. By contrast, Las Vegas and Phoenix posted the smallest monthly gains across all price tiers. Interestingly too, many high-cost metros, such as San Francisco, Seattle and Washington, saw the largest gains in high-priced segments of their respective housing markets.
The average monthly price gain for low-tier homes was 1.4%, similar to that of medium-tier homes, which were up by 1.3% (though those numbers are not seasonally adjusted). High-tier prices were up by 1.8% month over month on average (Figure 4).
Figure 4: Monthly Price Declines Averages 1.4% for Low Tiers, 1.3% for Medium Tiers and 1.8% for High Tiers
© 2023 CoreLogic,Inc., All rights reserved.
Finally, while March home prices in all markets were down compared with their respective peak months in 2022, the rates of decline slowed because of the monthly gains seen in many metros. Seattle and San Francisco continued to post the largest drops — down by 15% and 14%, respectively, but for both metros, these are improvements from declines recorded in February (Figure 5).
Figure 5: March Prices Are Down 3.7% from 2022 Peak
© 2023 CoreLogic,Inc., All rights reserved.
Looking ahead, while housing markets are showing signs of typical seasonal improvement from winter lows, the lack of inventory in many metros, combined with buyer responsiveness to changes in mortgage rates, reflect stronger than anticipated home price gains. Nevertheless, following the strong start to 2023, some potential homebuyers have since been hesitant due to many uncertainties, including banking turmoil, the debt-ceiling crisis, mortgage rate volatility and a continued lack of inventory of homes for sale, all of which suggest that the rest of 2023 will be rocky for housing markets. Nevertheless, demographic fundamentals combined with robust income growth and scarce inventory may mean that pressure on home prices will persist.
© 2023 CoreLogic,Inc., All rights reserved.