US CoreLogic S&P Case-Shiller Index Annual Growth Moves Higher in September, Up by 3.9%

West Coast housing markets, including San Francisco and Seattle, posted annual gains again, while Midwest metro areas are experiencing a renaissance in housing demand, particularly in Detroit and Chicago
Housing market activity, while trending along the lowest levels in more than a decade, is showing signs of stabilizing. In other words, while seasonal declines will pull home sales down in the months ahead, October home sales are now roughly equal to activity during the same period in 2022. This suggests that the fourth quarter of 2023 may see a slight increase in home sales compared with last year.
At the same time, the availability of for-sale listings has also stabilized to October 2022 levels. If this trend continues, 2024 may start off with more new listings than seen in early 2023. Nevertheless, while the balancing of the housing market is an encouraging sign, lower mortgage rates will be necessary to prompt a sustained increase in home sales.
In September, the U.S. CoreLogic S&P Case-Shiller Index increased by 3.9% year over year, the third month of annual increases following two months of annual declines (Figure 1). With the rebound in appreciation this year, home prices are now up by 1.3% compared with the June 2022 peak and up by 6.6% from the January 2023 bottom.
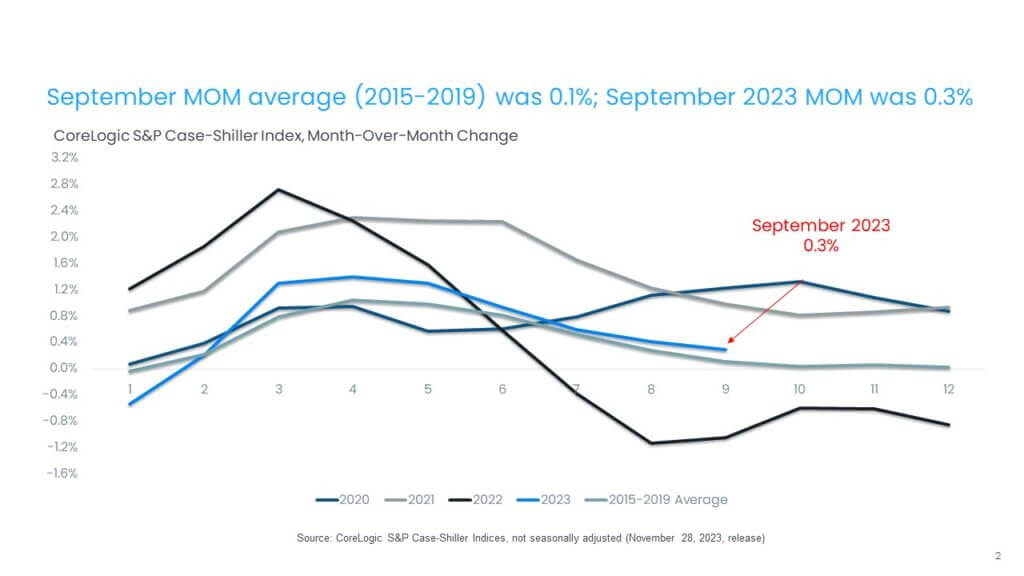
The non-seasonally adjusted month-over-month index posted its eighth straight month of strong gains, up by 0.3% in September, a smaller increase than the one recorded in previous months but slightly higher than the seasonal average of 0.1% seen between 2015 and 2019 (Figure 2).
Strong home price gains in the spring suggest that overall appreciation for the rest of 2023 will remain elevated and accelerate through the end of the year. Data from CoreLogic’s latest Home Price Index projects that U.S. home price growth will reach 5.4% by December before slowing down and will average a 3.8% increase in 2023 compared with the previous year. High mortgage rates, which are expected to remain above 7% through the middle of 2024, will dampen further appreciation, which is projected to average 3% in 2024.
The 10-city and 20-city composite indexes posted a third month of annual increases in September, up by 4.8% and 3.9%, respectively. Both indexes are also up by 7.4% and 7.1%, respectively, since the beginning of 2023. The 10-city index includes currently better-performing metros, such as New York and Chicago, which have seen relatively stronger housing markets since mid-2022, as the return to cities and offices has gotten underway. Metros with the strongest gains since the beginning of the year include San Diego, up by 10.7%; Detroit, up by 10%; and Chicago, up by 8.9%.
Compared with the 2006 peak, the 10-city composite index is now 47% higher, while the 20-city composite is up by 54%. Adjusted for inflation, which is showing signs of easing, the 10-city index is now 1% above its 2006 level, while the 20-city index is up by 6% compared with its 2006 high point. Nationally, home prices are 16% higher adjusted for inflation compared with 2006.
© 2023 CoreLogic,Inc., All rights reserved.
© 2023 CoreLogic,Inc., All rights reserved.
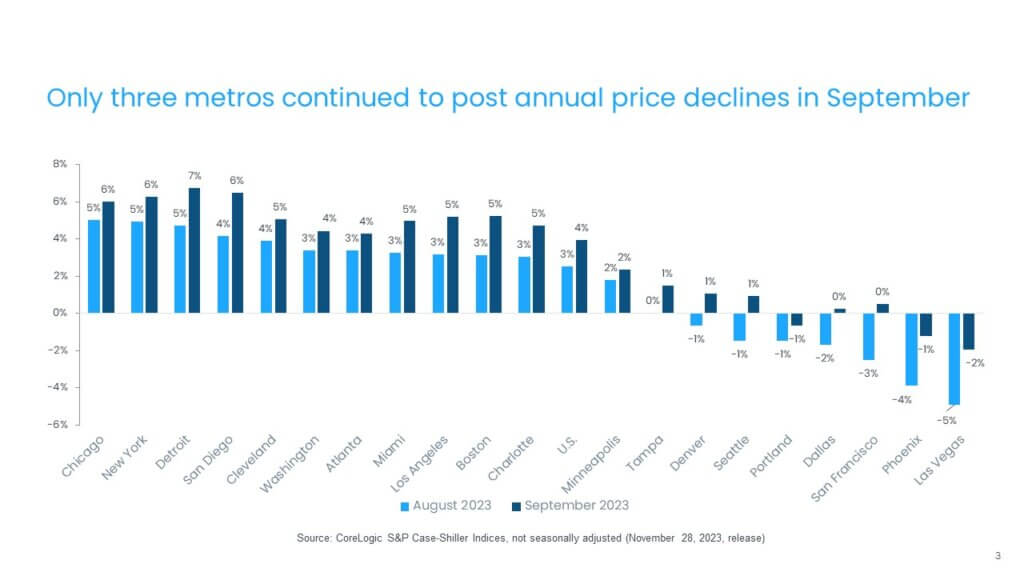
In September, while all 20 metros saw slower price growth year over year, all 20 metros saw annual home price gains reaccelerate from August (Figure 3). Detroit and San Diego again led the 20 cities, with annual gains of 6.7% and 6.5%; followed by New York, up by 6.3%; and Chicago, up by 6%.
However, the strongest month-over-month price acceleration from the previous month was again recorded in West Coast markets, particularly Las Vegas, San Francisco and Phoenix, which moved San Francisco from annual declines to an annual gain of 0.5% in September. Only three metros – Portland, Oregon; Phoenix and Las Vegas – continued to record annual declines, down from seven metros that posted declines in August.
© 2023 CoreLogic,Inc., All rights reserved.
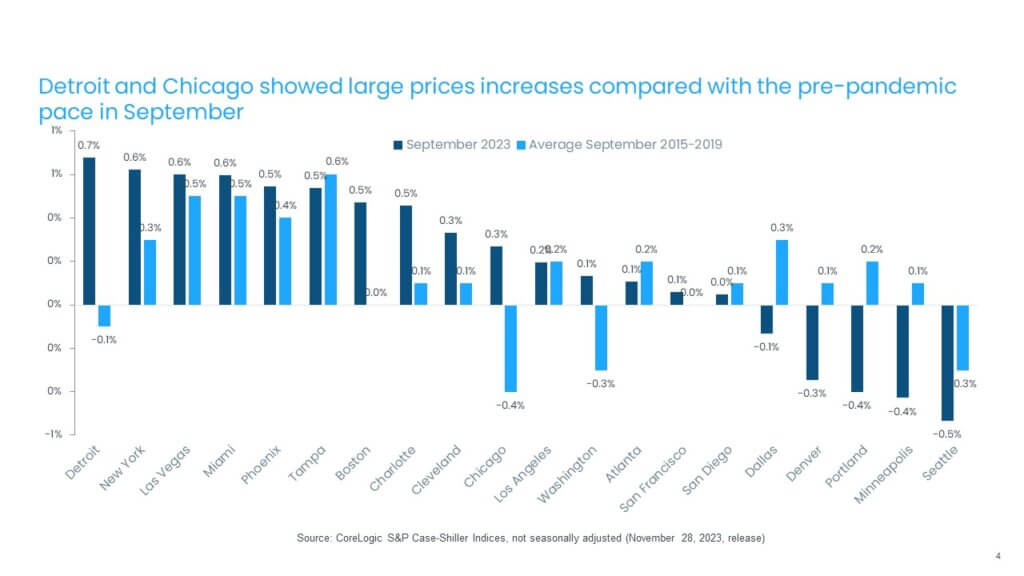
While home prices were up by 0.3% nationally from August to September, stronger than pre-pandemic levels, regional variances continue. Figure 4 summarizes the current year’s monthly gains in September compared with averages recorded between 2015 and 2019.
Detroit and New York posted the nation’s largest monthly gains, 0.7% and 0.6%, respectively. Detroit is seeing a strong uptick in home prices gains, which were declining prior to the pandemic at this time of the year. Other metros with strong monthly gains are located in the West – including Las Vegas and Phoenix – as well as markets in the Southeast, such as Miami; Tampa, Florida and Charlotte, North Carolina. Generally, many of the markets that experienced home price declines in 2022 or lagged in appreciation during the pandemic are now topping the list of high-price-growth metros. In contrast, Seattle, Minneapolis, Portland and Denver saw price weakness, but less than the pre-pandemic trend indicates (Figure 4).
© 2023 CoreLogic,Inc., All rights reserved.
Across price tiers, the high tier showed a relatively stronger rebound in September, with a 2.8% annual increase. The rebound in the high tier may partially reflect migration trends, suggesting that higher-income households are moving more permanently to areas that are relatively less expensive (San Francisco to San Diego, for example) and with more temperate weather (Seattle to Los Angeles, for example). The middle tier gained 3% in September, while the low tier increased by 3.7%.
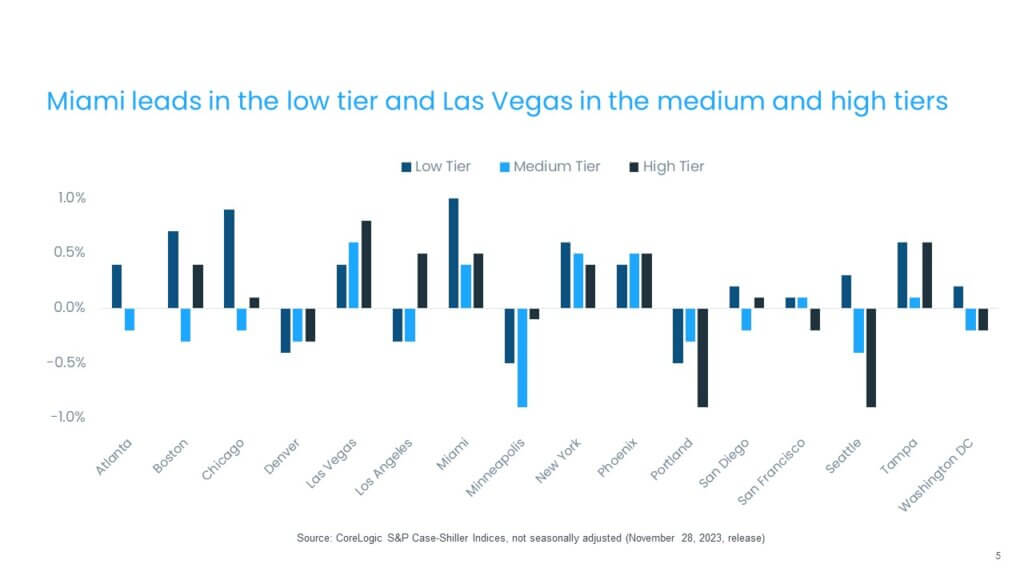
The month-over-month comparison of appreciation by price tier and location also reveals relative changes in demand across the country. In September, Miami, Chicago and Boston led the gains across the low-price tier, while Las Vegas and Tampa headed up the gains in the high tier. Overall, the high tier saw a mix of gains and losses, with the largest declines in Portland and Seattle (Figure 5).
© 2023 CoreLogic,Inc., All rights reserved.
As we approach the end of 2023, it is unlikely that there will be any major shifts in existing housing market trends, particularly as mortgage rates remain high and the winter is seasonally the slowest time of the year. Nevertheless, it is interesting to note that prices continue to show strength despite the dramatic increase in homeownership costs. The drivers behind home price gains remain to low inventory, particularly in the West; the migration of higher-income households; equity-rich baby boomers and a strong U.S. job market. This is especially true for regional markets with robust job growth and relative affordability.
© 2023 CoreLogic,Inc., All rights reserved.