U.S. Home Price Insights – January 2023

Introduction
The CoreLogic Home Price Insights report features an interactive view of our Home Price Index product with analysis through November 2022 with forecasts through November 2023.
CoreLogic HPI™ is designed to provide an early indication of home price trends. The indexes are fully revised with each release and employ techniques to signal turning points sooner.
CoreLogic HPI Forecasts™ (with a 30-year forecast horizon), project CoreLogic HPI levels for two tiers—Single-Family Combined (both Attached and Detached) and Single-Family Combined excluding distressed sales.
The report is published monthly with coverage at the national, state and Core Based Statistical Area (CBSA)/Metro level and includes home price indices (including distressed sale); home price forecast and market condition indicators. The data incorporates more than 40 years of repeat-sales transactions for analyzing home price trends.
HPI National Change
November 2022 National Home Prices
Home prices nationwide, including distressed sales, increased year over year by 8.6% in November 2022 compared with November 2021. On a month-over-month basis, home prices declined by 0.2% in November 2022 compared with October 2022 (revisions with public records data are standard, and to ensure accuracy, CoreLogic incorporates the newly released public data to provide updated results).
Forecast Prices Nationally
The CoreLogic HPI Forecast indicates that home prices will decrease on a month-over-month basis by 0.1% from November to December 2022 and on a year-over-year basis by 2.8% from November 2022 to November 2023.
Annual Home Price Growth Drops to Two-Year Low in November
Year-over-year home price growth ended its 21-month streak of double-digit momentum in November, posting an 8.6% gain, the lowest rate of appreciation in exactly two years. Although 16 states bucked the national trend and saw annual double-digit increases, appreciation is decelerating in many popular housing markets across the country. Southeastern states still led the country for price growth in November but also saw some of the most pronounced cooling. Similarly, relatively more expensive Western areas also posted substantial combined declines in recent months since spring’s peak.
Nationwide, the recent price deceleration pushed November home values 2.5% below the spring 2022 peak. In 2023, home values will likely move even further from that high point, as CoreLogic expects price growth to begin recording negative year-over-year readings in the second quarter.
“Although home price growth has been slowing rapidly and will continue to do so in 2023, strong gains in the first half of last year suggest that total 2022 appreciation was only slightly lower than that recorded in 2021. However, 2023 will present its own challenges, as consumers remain wary of both the housing market and the overall economic outlook.
And while the recent decline in mortgage rates may bode well for the housing market, potential homebuyers are grappling with the idea of buying amid possible further price declines and a continued inventory shortage. Nevertheless, with slowly improving affordability and a more optimistic economic outlook than previously believed, the housing market could show resilience in 2023.“
– Selma Hepp- Executive, Deputy Chief Economist for CoreLogic
HPI National and State Maps – November 2022
The CoreLogic HPI provides measures for multiple market segments, referred to as tiers, based on property type, price, time between sales, loan type (conforming vs. non-conforming) and distressed sales. Broad national coverage is available from the national level down to ZIP Code, including non-disclosure states.
Nationally, home prices increased 8.6 % year over year in November. No states posted an annual decline in home prices. The states with the highest increases year over year were Florida (18%), South Carolina (13.9%) and Georgia (13.6%).

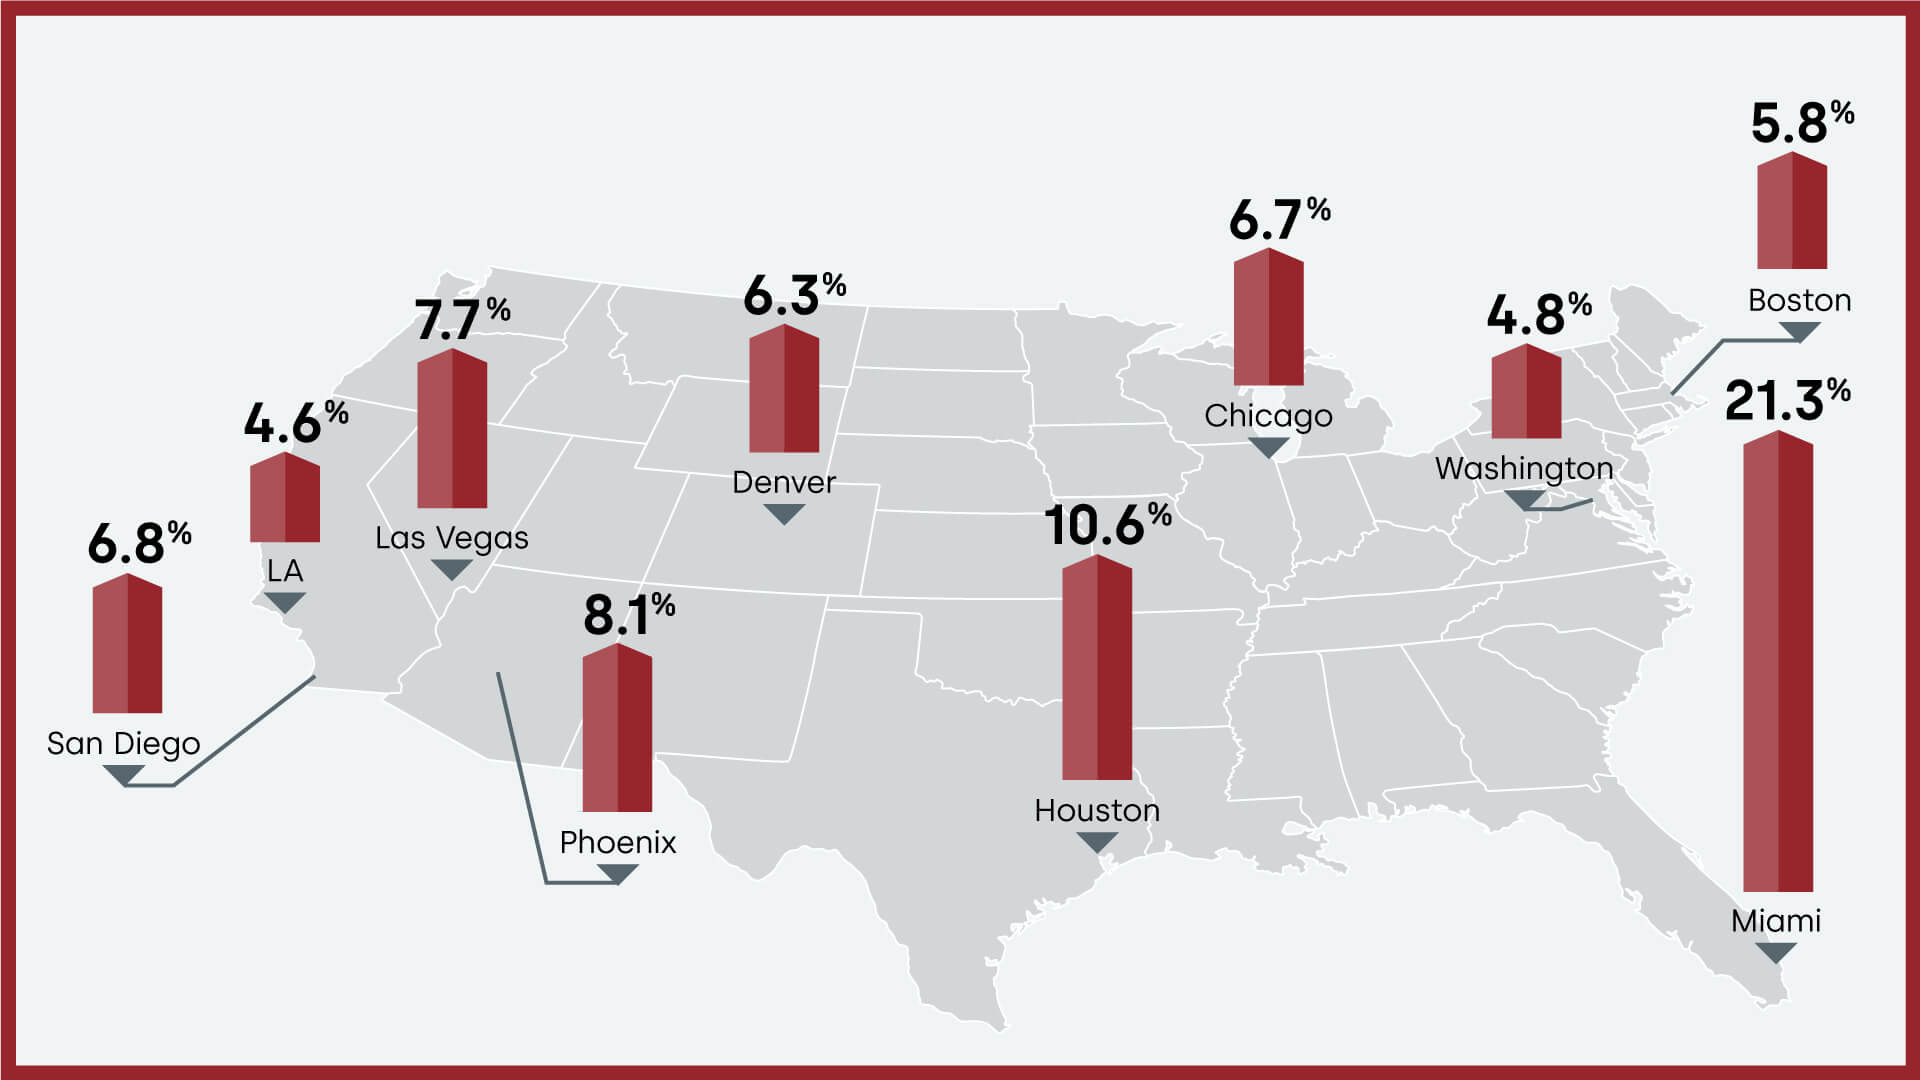
HPI Top 10 Metros Change
The CoreLogic HPI provides measures for multiple market segments, referred to as tiers, based on property type, price, time between sales, loan type (conforming vs. non-conforming) and distressed sales. Broad national coverage is available from the national level down to ZIP Code, including non-disclosure states.
These large cities continued to experience price increases in November, with Miami again on top at 21.3% year over year.
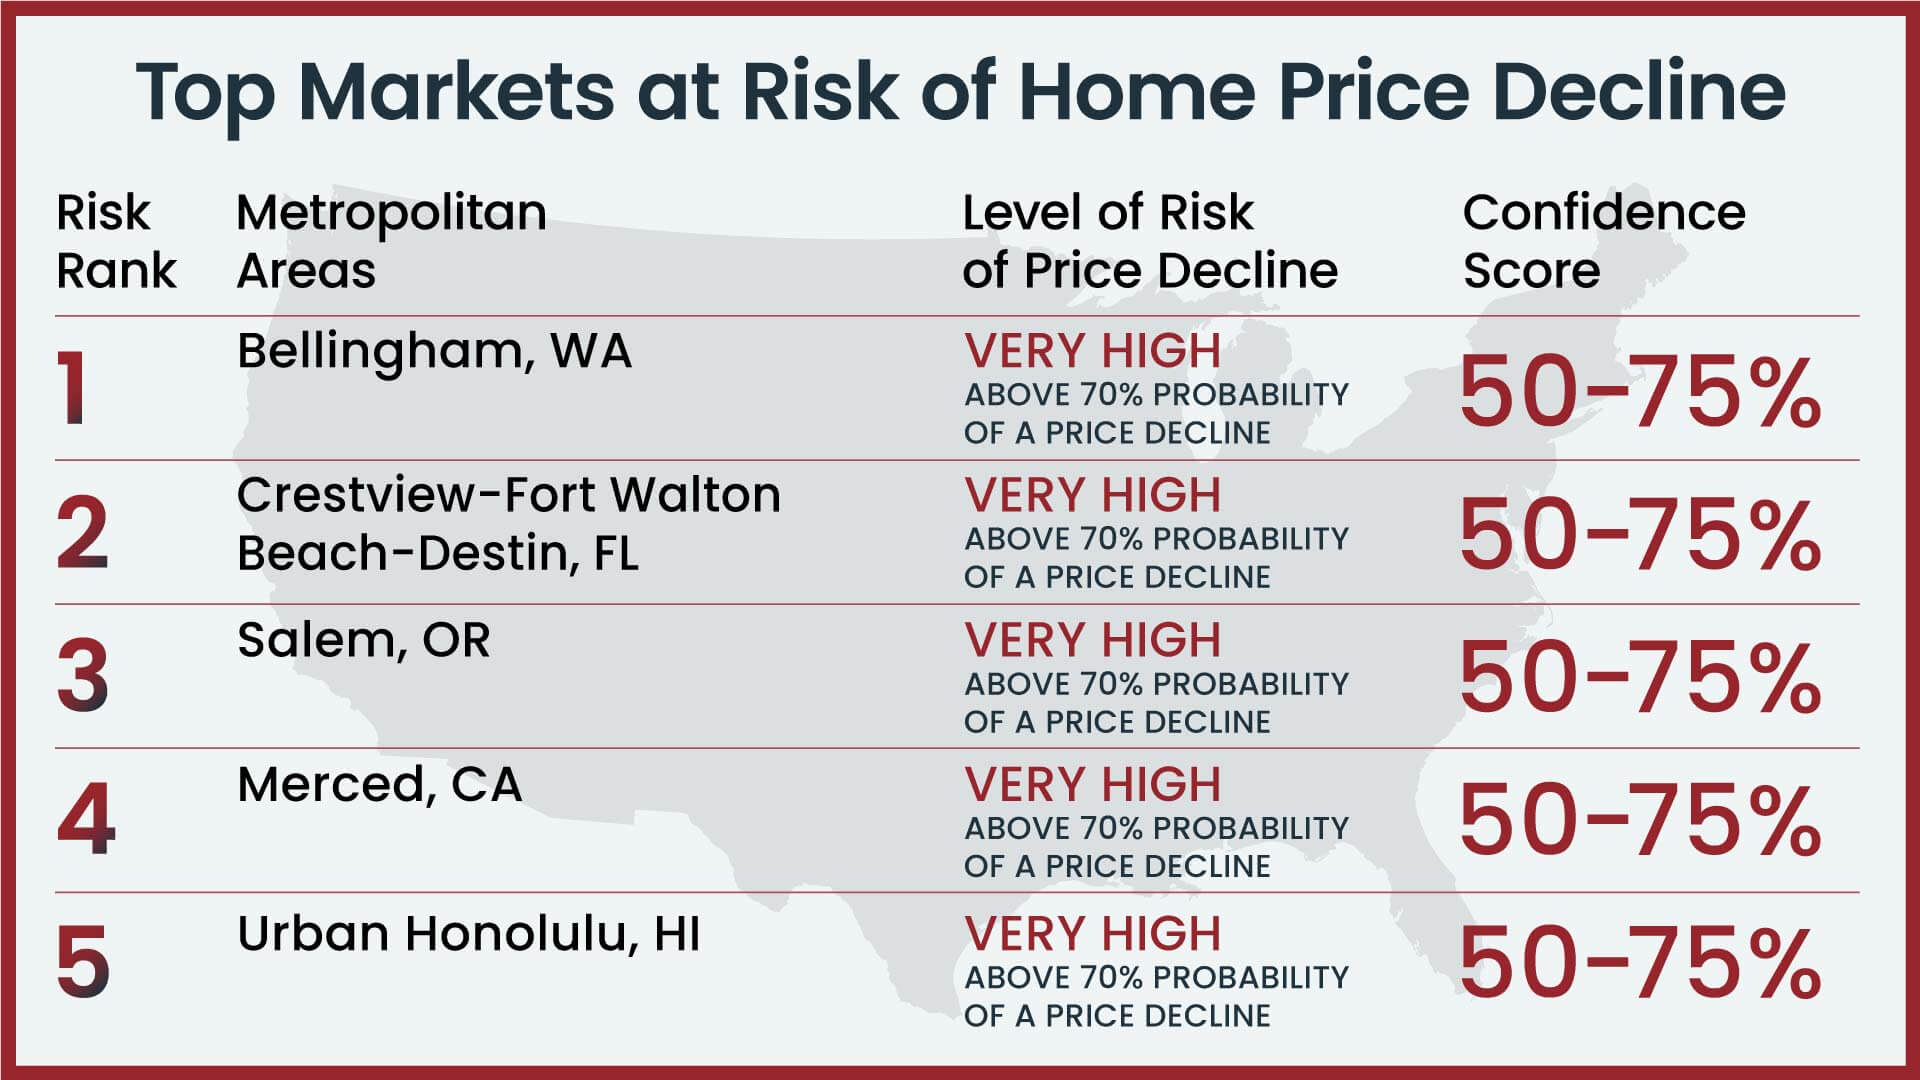
Markets to Watch: Top Markets at Risk of Home Price Decline
The CoreLogic Market Risk Indicator (MRI), a monthly update of the overall health of housing markets across the country, predicts that Bellingham, WA is at a very high risk (70%-plus probability) of a decline in home prices over the next 12 months. Crestview-Fort Walton Beach-Destin, FL; Salem, OR; Merced, CA and Urban Honolulu, HI are also at very high risk for price declines.
Summary
CoreLogic HPI features deep, broad coverage, including non-disclosure state data. The index is built from industry-leading real-estate public record, servicing, and securities databases—including more than 40 years of repeat-sales transaction data—and all undergo strict pre-boarding assessment and normalization processes.
CoreLogic HPI and HPI Forecasts both provide multi-tier market evaluations based on price, time between sales, property type, loan type (conforming vs. non-conforming) and distressed sales, helping clients hone in on price movements in specific market segments.
Updated monthly, the index is the fastest home-price valuation information in the industry—complete home-price index datasets five weeks after month’s end. The Index is completely refreshed each month—all pricing history from 1976 to the current month—to provide the most up-to-date, accurate indication of home-price movements available.
Methodology
The CoreLogic HPI™ is built on industry-leading public record, servicing and securities real-estate databases and incorporates more than 40 years of repeat-sales transactions for analyzing home price trends. Generally released on the first Tuesday of each month with an average five-week lag, the CoreLogic HPI is designed to provide an early indication of home price trends by market segment and for the “Single-Family Combined” tier, representing the most comprehensive set of properties, including all sales for single-family attached and single-family detached properties. The indices are fully revised with each release and employ techniques to signal turning points sooner. The CoreLogic HPI provides measures for multiple market segments, referred to as tiers, based on property type, price, time between sales, loan type (conforming vs. non-conforming) and distressed sales. Broad national coverage is available from the national level down to ZIP Code, including non-disclosure states.
CoreLogic HPI Forecasts™ are based on a two-stage, error-correction econometric model that combines the equilibrium home price—as a function of real disposable income per capita—with short-run fluctuations caused by market momentum, mean-reversion, and exogenous economic shocks like changes in the unemployment rate. With a 30-year forecast horizon, CoreLogic HPI Forecasts project CoreLogic HPI levels for two tiers — “Single-Family Combined” (both attached and detached) and “Single-Family Combined Excluding Distressed Sales.” As a companion to the CoreLogic HPI Forecasts, Stress-Testing Scenarios align with Comprehensive Capital Analysis and Review (CCAR) national scenarios to project five years of home prices under baseline, adverse and severely adverse scenarios at state, metropolitan areas and ZIP Code levels. The forecast accuracy represents a 95% statistical confidence interval with a +/- 2% margin of error for the index.
About Market Risk Indicator
Market Risk Indicators are a subscription-based analytics solution that provide monthly updates on the overall “health” of housing markets across the country. CoreLogic data scientists combine world-class analytics with detailed economic and housing data to help determine the likelihood of a housing bubble burst in 392 major metros and all 50 states. Market Risk Indicators is a multi-phase regression model that provides a probability score (from 1 to 100) on the likelihood of two scenarios per metro: a >10% price reduction and a ≤ 10% price reduction. The higher the score, the higher the risk of a price reduction.
Source: CoreLogic
The data provided are for use only by the primary recipient or the primary recipient’s publication or broadcast. This data may not be resold, republished or licensed to any other source, including publications and sources owned by the primary recipient’s parent company without prior written permission from CoreLogic. Any CoreLogic data used for publication or broadcast, in whole or in part, must be sourced as coming from CoreLogic, a data and analytics company. For use with broadcast or web content, the citation must directly accompany first reference of the data. If the data are illustrated with maps, charts, graphs or other visual elements, the CoreLogic logo must be included on screen or website. For questions, analysis or interpretation of the data, contact Robin Wachner at [email protected]. For sales inquiries, contact [email protected]. Data provided may not be modified without the prior written permission of CoreLogic. Do not use the data in any unlawful manner. The data are compiled from public records, contributory databases and proprietary analytics, and its accuracy is dependent upon these sources.
About CoreLogic
CoreLogic is a leading global property information, analytics and data-enabled solutions provider. The company’s combined data from public, contributory and proprietary sources includes over 4.5 billion records spanning more than 50 years, providing detailed coverage of property, mortgages and other encumbrances, consumer credit, tenancy, location, hazard risk and related performance information. The markets CoreLogic serves include real estate and mortgage finance, insurance, capital markets, and the public sector. CoreLogic delivers value to clients through unique data, analytics, workflow technology, advisory and managed services. Clients rely on CoreLogic to help identify and manage growth opportunities, improve performance and mitigate risk. Headquartered in Irvine, Calif., CoreLogic operates in North America, Western Europe and Asia Pacific. For more information, please visit www.corelogic.com.
CORELOGIC, the CoreLogic logo, CoreLogic HPI and CoreLogic HPI Forecast are trademarks of CoreLogic, Inc. and/or its subsidiaries. All other trademarks are the property of their respective owners.
For More Information
For more information, please email [email protected].
For sales inquiries, please email [email protected]