Where A U.S. Housing Crash Will Hit The Hardest

mphillips007
Home prices are declining across the United States. It’s no longer a debate whether or not home prices will fall, the only question now is how much and where, because home prices are certainly not falling equally across the whole country.
Case-Shiller, EPB Research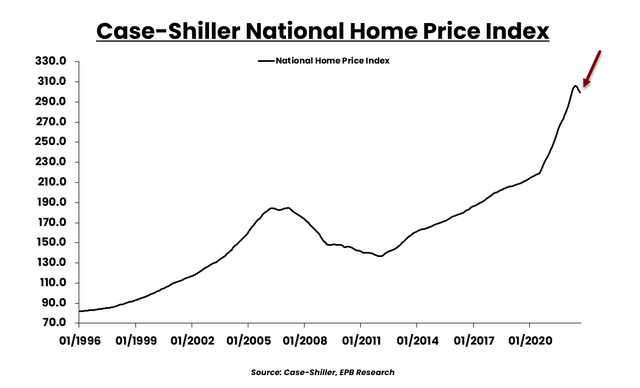
The Case-Shiller National Home Price Index has so far declined 2.2% from the peak in home prices which was roughly over the summer of 2022. So 2.2% over a several-month period.
Case-Shiller, EPB Research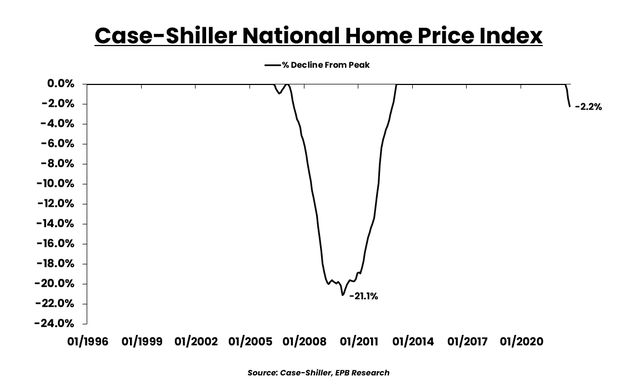
2.2% may not seem like a lot, but as we all know, real estate is regional.
Case-Shiller, EPB Research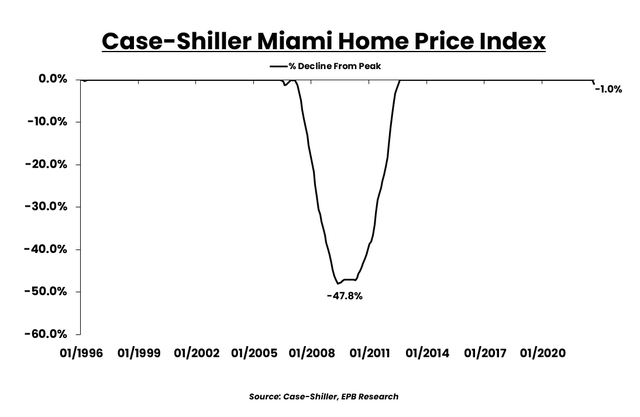
There are some major cities like Miami that are down less than 1% from the peak, and there are some areas like Seattle and San Francisco that have seen 10% declines in just a matter of months.
Case-Shiller, EPB Research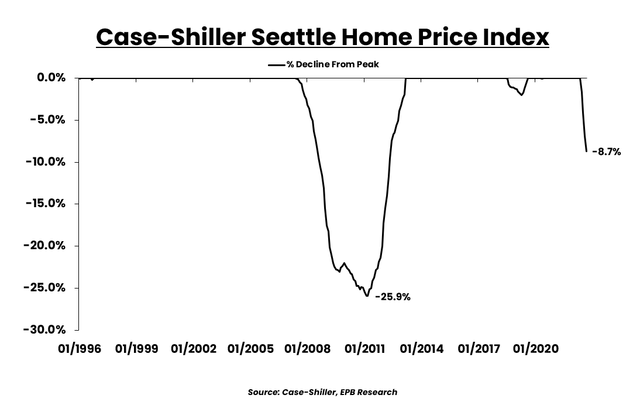
In this article, I’m going to break down the trends in home prices across the entire country. I’ll show you where home prices are completely crashing and where home prices are actually still rising.
We’ll also look at inventory trends, and at the end of the article, I’ll make some comments about where the US housing market is heading in 2023.
Over the summer, as home prices were peaking, I wrote an article about my leading indicator of home price growth and showed why home prices were going to have sharp declines in the future, and that is now starting to unfold.
Before discussing where the housing market is heading, let’s start by looking at the national trends and then see what’s going on in major cities around the country.
As I mentioned, national home prices are down about 2% from the peak levels of this year, but there are a few things to note.
First is that home price data, while reliable, is quite delayed. The Case-Shiller Home Price Index, for example, which is a very reliable index, is updated for September. Some other data which I’ll show is updated for October.
Second is that, as with everything in economics or the economy, the rate of change is the most important factor. While home prices have just started to turn down, it’s the speed of the change that is quite alarming.
For example, this chart shows the 3-month annualized change in national home prices. In other words, in the months of February, March, and April of 2022, that three-month period, home prices were rising at a pace of 25% per year.
Case-Shiller, EPB Research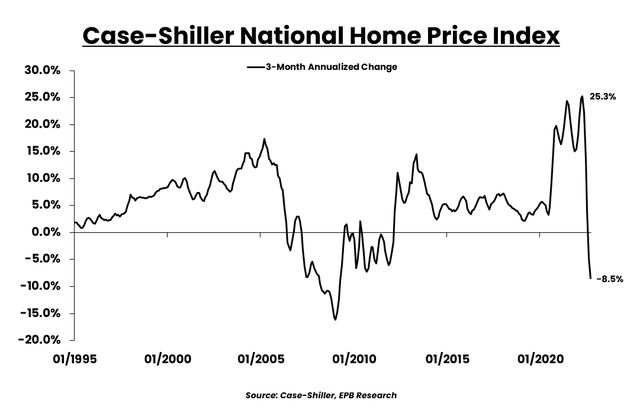
In the past three months ending September, home prices nationally are declining at an 8.5% annual rate. A stunning change of direction, something we’ve never seen before in the history of home prices.
Over the past 30-years, home prices haven’t declined this rapidly on a 3-month basis outside of the 2008 crisis.
In fact, some cities are showing declines even more rapid than the 2008 crisis.
This chart shows the 20 major cities around the United States, as well as the national average. The blue dots on the right-hand side of the chart shows the 3-month rate of home price growth from March 2022, roughly the peak of the bubble in terms of home price appreciation.
EPB Research – St. Louis Fed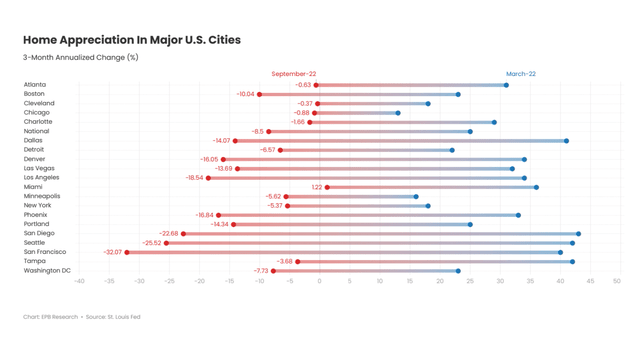
Almost every major city had home prices that were rising at a 20% or 30% annual rate. Unprecedented levels of home price appreciation. Cities like Dallas, San Diego, Seattle, and San Francisco and Tampa saw home price growth above 40% on a 3-month annualized basis.
The red dots on the left show the annual pace of home price declines over the last 3-months. Almost every city is now showing declining home price growth and some are declining at a 20% or 30% annual rate. Which is completely crashing.
Here is another way to look at it. On the left is the 3-month rate of change from March 2022 and on the right is the most recent data.
EPB Research – St. Louis Fed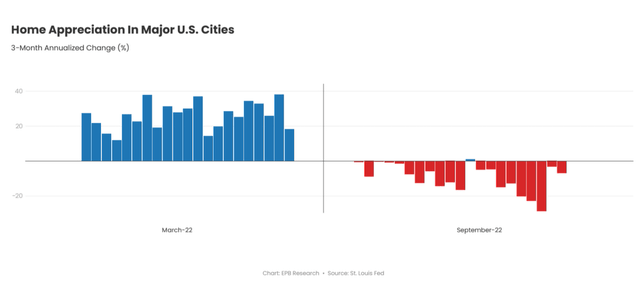
In March, all 20 major US cities had home price growth that was positive, and most cities were rising at a ridiculous 20% or 30% rate.
Today, every major city has declining home prices except Miami, which has been roughly flat over the last few months.
Home prices over the last three months aren’t just flattening out as many people suggested; in some cities like Miami, sure, there has been a flattening of prices, but in many parts of the United States, a home price crash is the only word to describe prices falling at 20% or 30% annual rates.
In March 2022, every major city had positive home price growth shown in this map. Red means home prices are falling, and blue means home prices are rising. In March, home prices were rising in all 20 major cities.
EPB Research – St. Louis Fed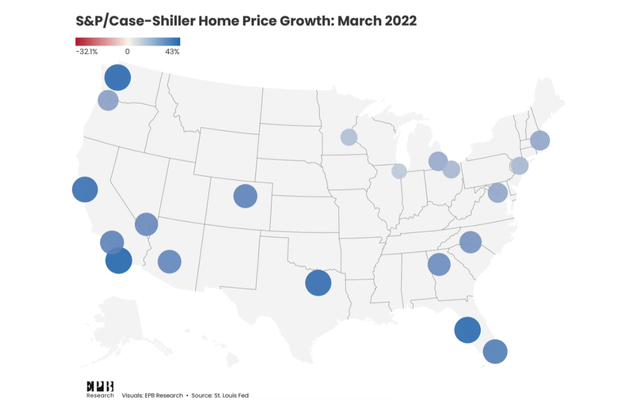
Fast forward to today and home prices are falling everywhere, except Miami, with the worst declines, or the darkest red bubbles, clearly concentrated on the West Coast of the United States.
EPB Research – St. Louis Fed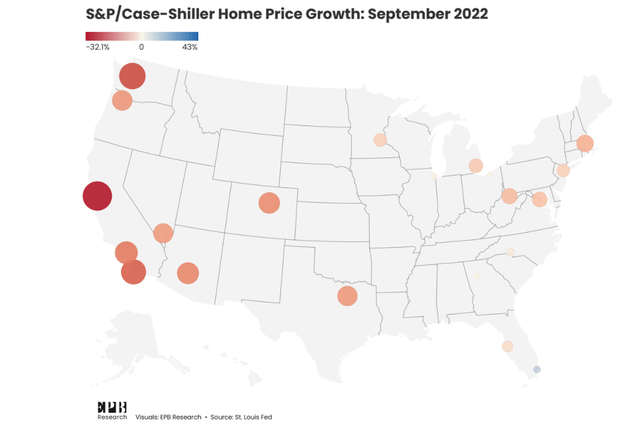
Let’s get a little more granular. This chart shows how much home prices increased from before COVID, January 2020, to the peak in April 2022. The two-year housing mania. Each dot represents a county within that state and you can see that almost every single dot is blue, which means home prices rose in every state in every county with very few exceptions.
EPB Research – Realtor.com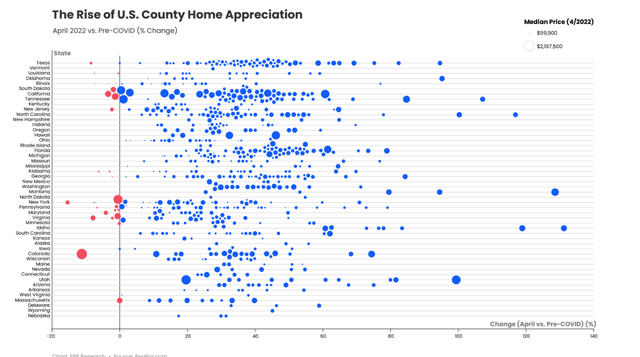
If we look at the same chart but measure home prices today compared to April of 2022, we can see more than half the dots are red, which means home prices are falling across a relatively large share of US counties.
EPB Research – Realtor.com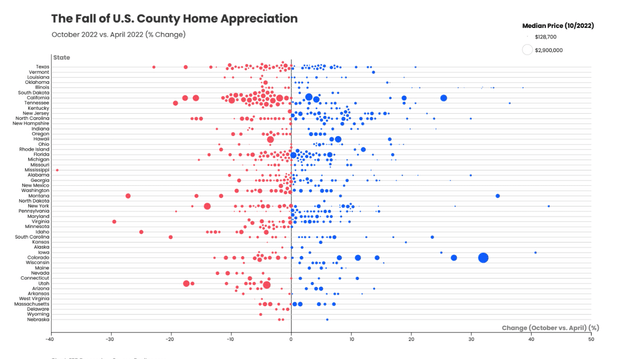
Most of the very big problem areas that are seeing home prices crash at a speed even faster than 2008 are on the West Coast. Let’s take a look at that now.
I keep looking at the data in two parts. From before the pandemic to the peak in March or April of 2022 and then from the peak through today or the most recent data.
I am doing this because inflection points are the most important thing in economics or the economy. You always want to be looking for the major inflection points in momentum, and the spring of 2022 was certainly the inflection point for the US housing market.
This next map shows the change in home prices from before COVID, January 2020, through April 2022, the peak in the bubble. Blue dots are everywhere, which means that home prices increased just about everywhere except a few areas, one for example, being NYC, which was uniquely impacted by the pandemic.
EPB Research – Realtor.com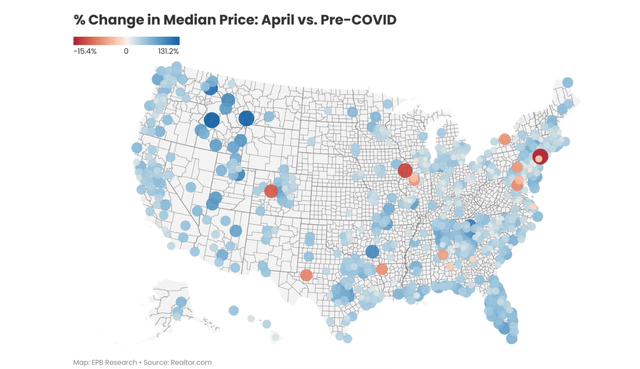
This map shows the change in home prices from the peak of the bubble, April 2022, through today. Red dots show home prices that have fallen from the peak, and blue dots show home prices that are still rising.
So the data is clear that home prices nationally are declining and at a relatively fast pace. This map really shows us just how regional the housing market is.
EPB Research – Realtor.com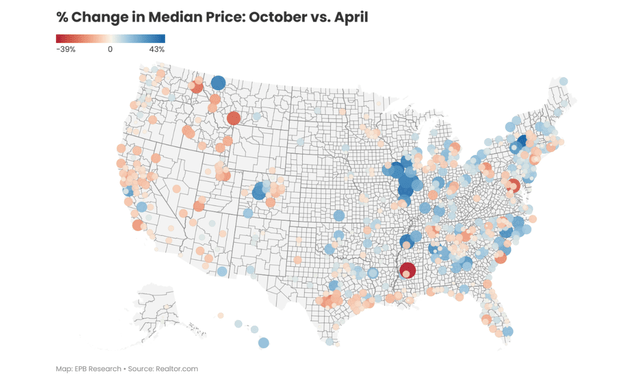
The West Coast is getting hit hard. San Diego, San Francisco, Seattle, and Portland are some of the worst declines we’ve seen in the US housing market, falling 15, 20 and even 30% in some counties already.
We see blue dots, or home prices that are still rising, in parts of Florida, up the East Coast in the Carolinas and in the Chicago area.
The New York area is mixed.
In terms of major cities, San Francisco leads the nation in price declines with homes falling 10% on average in just the last few months.
Case-Shiller, EPB Research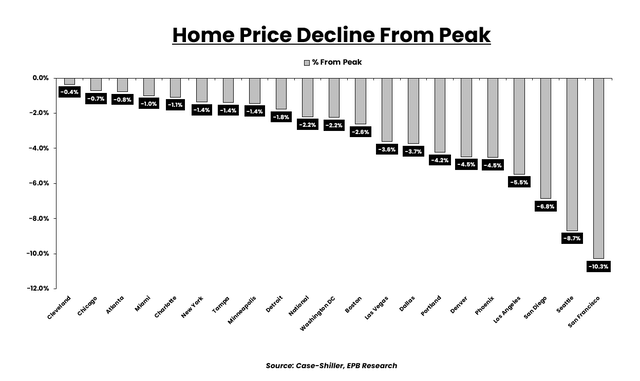
Seattle, San Diego, Los Angeles, Phoenix, and Denver are also posting declines much greater than the national average.
Cleveland, Chicago, Atlanta, Miami, Charlotte, New York and Tampa have had no material declines so far, just a flattening of home price growth. Prices are basically holding flat in these areas.
Let’s take a look at inventory or active listings across the country. Part of the boom in home prices can be attributed to the fact that housing supply was very tight meaning that there were not many houses for sale.
This chart shows the % change in active listings from before COVID, or January 2020, through the peak in April 2022. Basically every county in the country had active listings that were down 50, 60%, or 70% in that two year period.
When you couple less inventory with lower mortgage rates, that’s a recipe for an explosion in home prices.
EPB Research – Realtor.com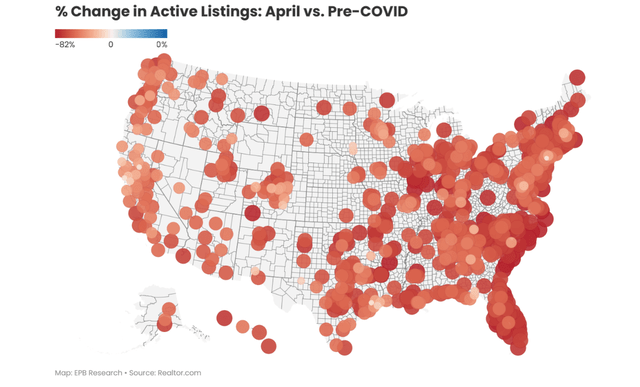
Now we’ve seen the inventory situation flip. Relative to April of this year, the peak in home price growth, we’re now seeing active listings increase just about everywhere. Some places are darker blue which means a larger jump in inventory like Dallas and Austin. We also see bigger jumps in inventory in Seattle, Portland, parts of Utah and Idaho.
If you look at the New York area, all the dots are barely blue, almost white, which means inventory is barely increasing at all. This is why home prices aren’t declining as fast on the East Coast.
EPB Research – Realtor.com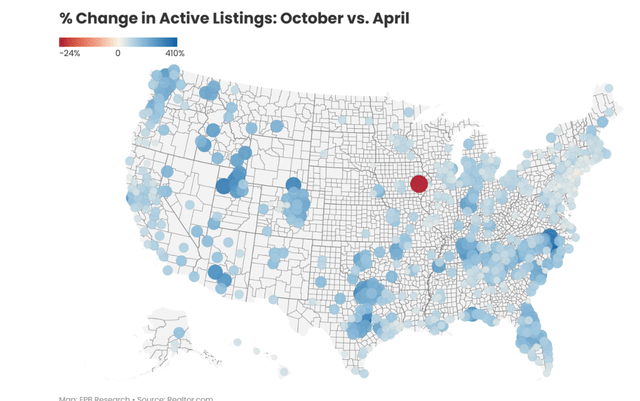
So let’s recap what we know so far.
We know that home prices on a national level have started to fall and the pace that home prices are falling is rather worrisome. Home prices over the last 3 months of data are declining at an 8.5% annual pace which is extremely fast, not really seen over the last 30 or 40 years outside of the 2008 period.
Case-Shiller, EPB Research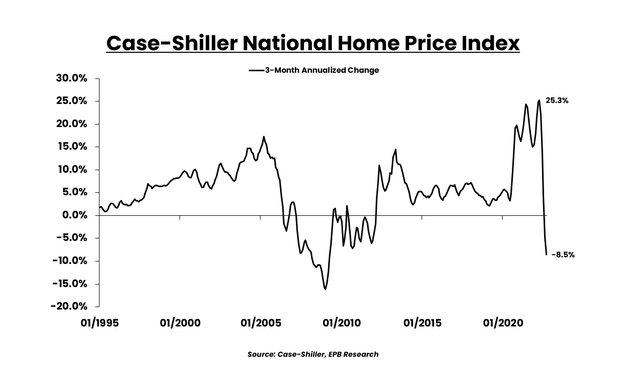
The market is very split, however, as home prices are still climbing over the last 3 months in Miami and basically flat in multiple cities along the East Coast.
Major cities on the West Coast of the United States are seeing home prices crash at 20, 25, and even 30% annual rates which is a complete crash anyway you cut it.
These declines haven’t persisted for as long as the 2008 crash, yet, but the data speaks for itself, in places like Seattle or San Francisco, where home prices are falling at 25% or 30% annual rates, worse than the levels seen in the depths of 2008.
EPB Research – St. Louis Fed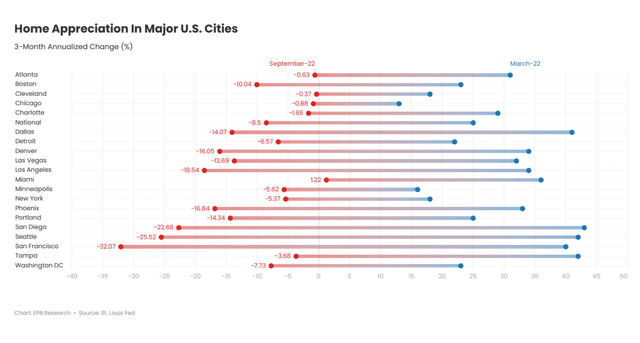
So why is this happening? There are two reasons.
The first are broad, national macroeconomic factors that I outlined in my article forecasting declines in home prices such as higher mortgage rates, tighter monetary policy, and increasing supply of newly constructed homes. These factors are depressing home prices on a national level.
The regional disparity, however, is mainly caused by a demographic shift that’s underway in America where many people are leaving West Coast cities or higher tax jurisdictions for lower tax, more pro-business states on the East Coast, particularly in the South.
Case-Shiller, EPB Research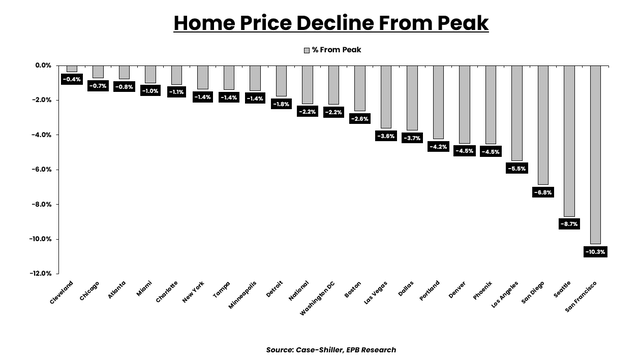
As is usually the case during housing booms, there was the usual stories of speculative building in common boomtowns like Vegas, Austin and Phoenix.
To the extent that these demographic trends persist, then we can expect the housing market to remain very different with downward pressure on higher tax West Coast states and more tailwinds for the South East.
I personally don’t specialize in these regional trends but I do specialize in the broad macro factors that are causing downward pressure on home prices nationally.
Over the summer, I published an article outlining some of the factors that go into my leading indicator of home price growth, factors that predicted the major shift in the housing market we are witnessing right now.
In that article, I mentioned three factors including the rate of change in monetary policy or monetary growth, the months supply of newly constructed homes and the spread between mortgage rates and Treasury rates as a measure of risk.
With the most recently available data, the rate of real M2 or real money supply growth continues to decline, hitting new lows which means monetary policy is extremely restrictive right now which is not supportive of rising home prices.
When money supply growth is high, this can push liquidity or push money into assets like stocks and homes, increasing the price of assets.
When money supply growth is low, or negative like it is now, this can suck money out of asset prices like stocks and home prices so the fact that money supply growth is deeply negative right now means there is less money available to flow into assets like home prices.
Federal Reserve, Freddie Mac, EPB Research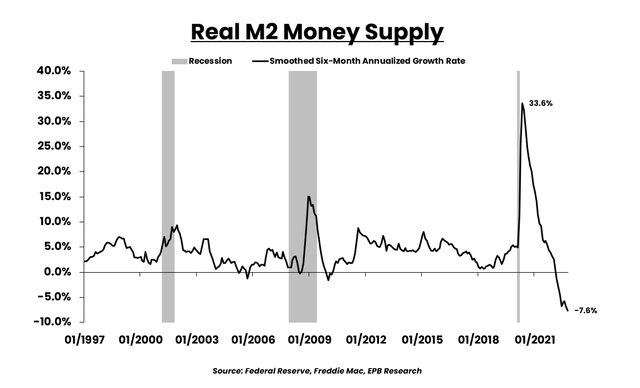
The Federal Reserve is really tightening liquidity to combat inflation, so that is certainly still a negative force for the housing market on a national level.
Secondly, the months supply of new homes is rising rapidly, currently sitting at 9, which is very loose and indicative of price cuts coming from home builders.
We see highly negative commentary and many admissions of price cuts coming from builders in the National Association of Home Builder Sentiment Survey, as well as private homebuilder surveys by companies like John Burns Real Estate consulting.
Census Bureau, EPB Research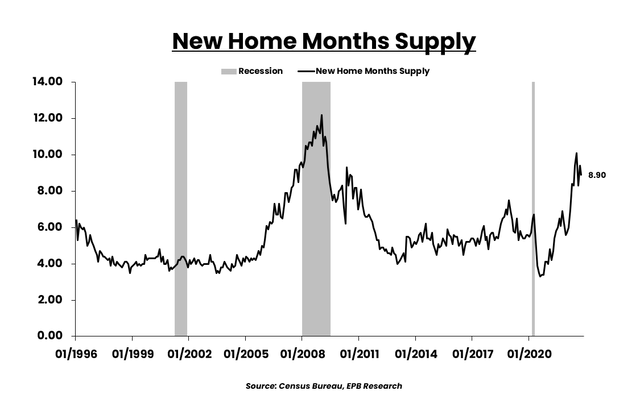
In fact, the current months supply number of newly constructed homes is actually too low because in October, the cancellation rate on new homes surged. The new home sales data is reported as a gross number so it doesn’t take into account these cancellations.
John Burns Real Estate Consulting shows us that the cancellation rate hit 25.6% in October, a massive jump compared to September and a surge relative to October of last year.
John Burns Real Estate Consulting, EPB Research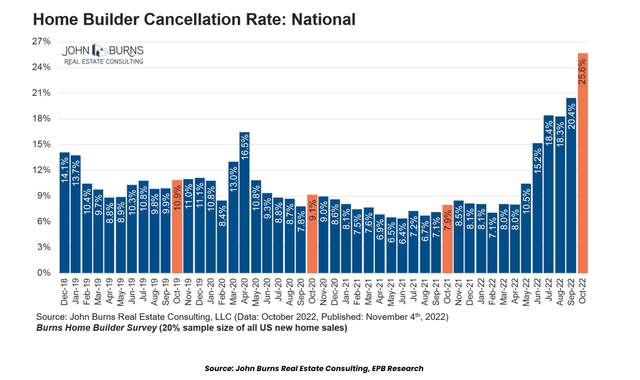
So the months supply for new homes is likely even higher than currently reported and we’ll have to wait a few months for revisions to sort this out.
Even still, the months supply of new homes is a better indicator of future price growth than existing or total homes months supply because builders are price setters. I ran the regression between future home price growth and the months supply of new, existing and total US housing, and the new home months supply held the tightest relationship.
So months supply is rising rapidly for builders, and still rising, it’s not falling, so there is nothing to suggest home price growth will do anything other than continue declining since builders are becoming more and more saddled with new home supply.
NAR, Census Bureau, Case-Shiller, EPB Macro Research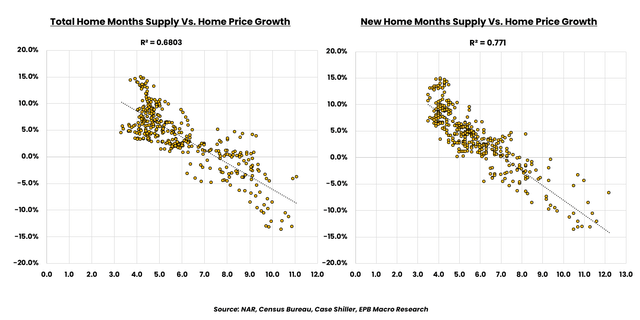
The last variable I mentioned was the spread between mortgage rates and Treasury rates. This chart takes the 30-year mortgage rate minus the 10-year treasury rate. The wider that spread, the more risk lenders think there is in the housing market. You can see how this spread spikes upwards in recessionary periods.
When the Federal Reserve was buying billions and billions of dollars of mortgages per month, this spread was likely artificially suppressed. As the Fed stopped buying mortgage bonds and stopped supporting the housing market, this spread widened materially.
Federal Reserve, Freddie Mac, EPB Research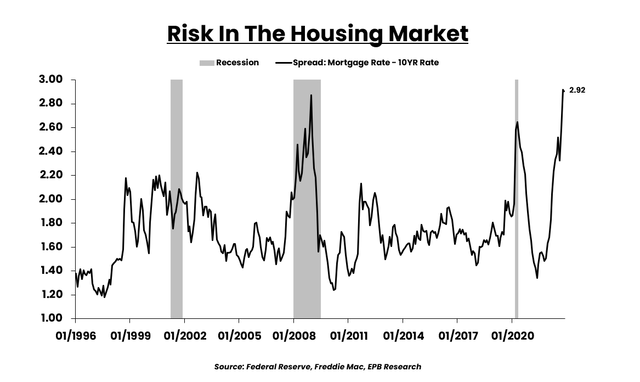
So the three factors put together, declining monetary growth or liquidity, rising supply for home builders and a wider mortgage spread are three reliable signals that tell us home prices will stay with this downward momentum and keep declining.
Just to throw in a few more reliable variables, we can also look at the traffic of prospective buyers from the housing market index survey or the weekly level of mortgage purchase applications to confirm there is little chance of a pickup in momentum for the national housing market in the next few months.
National Association of Realtors, EPB Research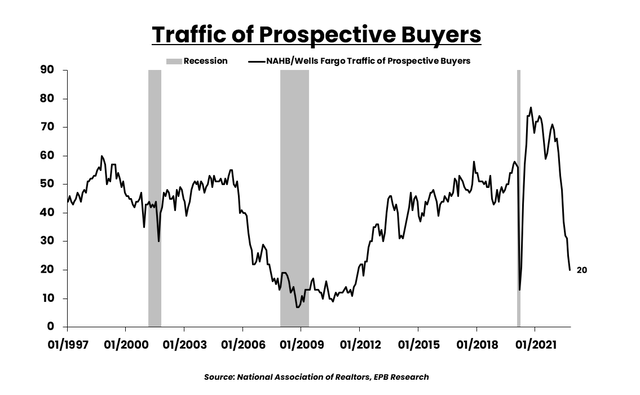
So from a broad macro perspective, there will be more downward pressure on home prices in the months ahead. There is nothing in the immediate view that is an overwhelming positive for home price growth.
Easier monetary policy and lower interest rates would certainly help but the Federal Reserve is unlikely to come to the rescue while inflation is much above their 2% target.
So this downward pressure will keep coming with completely different intensities depending on where you are in the United States. In some places, home prices are likely to continue falling at stunning speeds as demographics are terrible with people moving out and broad macro factors are highly negative.
Other parts of the country may only experience a flattening out of home prices or price declines of 5%-10% as there is a tug-of-war between positive demographic inflows and poor national macro factors.
So will home prices keep falling? Broadly speaking, the answer, for now, is yes, they will.
Where will the housing market crash hit the hardest?
Right now it’s the high-cost West Coast states with demographic outflows like Portland, Seattle, and parts of California, most specifically. The East Coast is holding up better than the West Coast.
Broad macro factors will put pressure on home prices everywhere while these demographic trends will dominate the regional disparities.