How Multifamily Investment Trended in 2022 – Multifamily Real Estate News

The year 2022 has managed to surprise quite a few when it comes to multifamily investment patterns and preferences, leaving room for further interpretation. The Fed’s aggressiveness in reducing inflation has already raised short-term rates by 375 basis points through November and will likely push them up another 150-200 basis points by early next year. In a typical environment, the impact on multifamily prices and deal flow would have to be significant. But as we still exit a pandemic, “typical” is off the table.
To shed some light on how the investment market was faring at the end of the third quarter of 2022, we perused Yardi Matrix’s transactions data—which covers all multifamily properties of 50-plus units across 140 markets—and the findings are fascinating: Nationally, the sales volume through the third quarter rose to nearly $157.5 billion, above the figure recorded during the same interval last year—$129.9 billion—a year that is in the books as the best one ever (thus far) for transaction volume.
To reach this total, of the 140 metros tracked by the data provider, a massive 73 markets recorded higher volumes of multifamily sales during the first three quarters of the year compared with the first three quarters of 2021. In another 17 markets, the volume remained flat—defined by a margin of 9.9 percent below, to 9.9 percent above the sales volume registered last year during the corresponding period. Decreases in the sales volume were present in 31 markets.
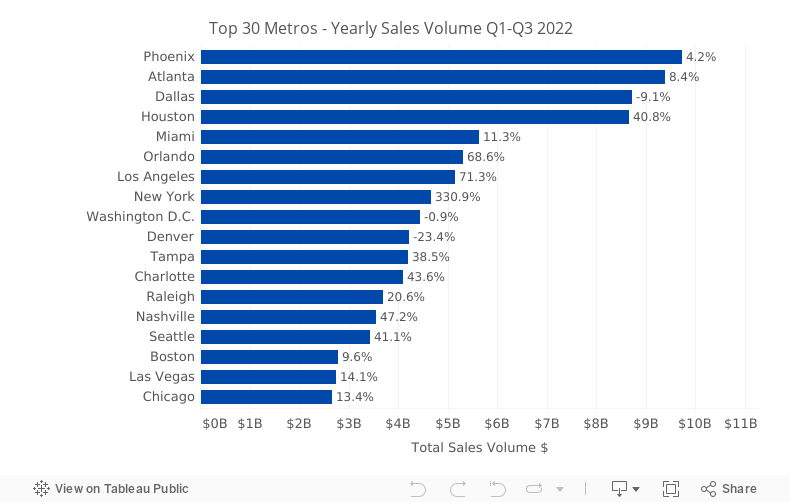
Narrowing the results, we drilled down to Yardi Matrix’s top 30 markets and the findings are of a similar pattern: in 19 markets transaction volumes increased, in seven figures remained virtually flat and, in four, investment figures were lower than the year prior.
In this study, we are looking at the top 30 markets grouped by how investment volumes performed.
Markets with multifamily investment volumes increases
In 2022 through September, the multifamily investment volume in these 19 markets totaled $64.2 billion, accounting for 40 percent of the national sales volume. Last year through the same interval, investors had traded $44.4 billion in multifamily assets.
Increases over last year ranged from as low as 11 percent in San Antonio, to as high as 620 percent in San Jose. Upon a closer look, these extremes illustrate these markets’ general performances: San Antonio posted a steadier performance, with a quicker post-pandemic rebound ($2.1 billion sales volume through the third quarter in 2021), while San Jose’s density and the outmigration that derived from it during the height of the pandemic kept investors cautious for longer (just $96.7 million through the third quarter of 2021).
By volume, San Jose and Detroit were the only two markets in this ranking not to reach the $1 billion-mark during the first three quarters of 2022 or any year before this. While San Jose showed a rebound to pre-health crisis figures—$624 million through the third quarter in 2019—Detroit had recorded limited transaction activity pre-pandemic ($151 million through Q3 2019), which could point to a promising and long-awaited recovery.
At the other end of the spectrum, the highest transaction volumes were registered in Houston ($8.7 billion), Miami ($5.6 billion) and Orlando ($5.3 billion). Houston’s evolution is astonishing—from $3.3 billion through Q3 2019, to $1.6 billion through Q3 2020, to a whopping $6.2 billion last year); Miami also had a post-pandemic resurgence—down from $2.1 billion in 2019 to $1.2 billion in 2020, and then up to $5.1 billion in 2021.
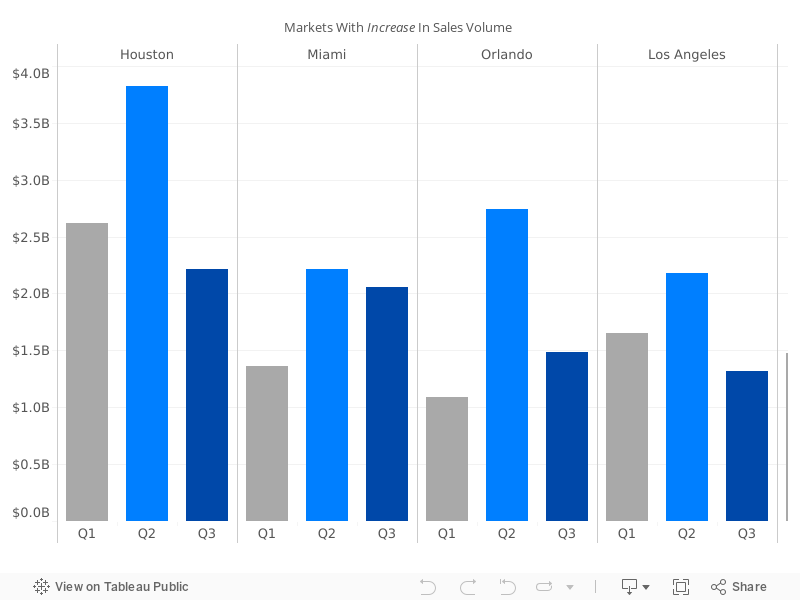
Detroit and San Francisco were the two markets that responded almost immediately to the Fed’s interest rate increase, as their quarterly investment totals decreased gradually from the first quarter to the third. Indianapolis, San Antonio, Las Vegas, Nashville, Raleigh-Durham, Charlotte, Tampa, New York, Los Angeles, Orlando, Miami and Houston—are the metros with the highest sales volumes reported during the second quarter. In San Jose, Sacramento, Twin Cities, Chicago and Seattle, the second quarter was the weakest interval of the year so far in transactions.
Despite the ongoing turbulence in the economic landscape, three metros thrived during the third quarter, with the sales volume during this interval surpassing those of the two preceding quarters—San Jose ($643 million), Sacramento ($615 million) and Chicago ($1.3 billion).
READ ALSO: Top 5 Western Markets by Multifamily Investment Volume
Markets with flat multifamily investment volumes
The multifamily investment volume in the seven markets in this tier amounted to $39.3 billion, a quarter of the sales volume through the third quarter of 2022, just slightly above the $39 billion recorded during the same period last year. Of these seven markets, the volume declined by less than 10 percent in Dallas, Austin and Washington, D.C., and posted increases below 10 percent in Phoenix, the Inland Empire, Atlanta and Boston.
Leaders in total volumes were Phoenix and Atlanta, both over the $9 billion-mark during the period, followed closely by Dallas with more than $8.7 billion. Atlanta, Boston, Dallas, the Inland Empire and Phoenix posted in 2022 the best first three quarters ever in multifamily sales. Of the seven, Washington, D.C., maintained a remarkably steady performance sales-wise since 2019 onward, with totals through the third quarter of each year in the $3.6 billion to $4.5 billion range—$4.3 billion in 2019, $3.6 billion in 2020, $4.5 billion in 2021 and $4.4 billion in 2022.
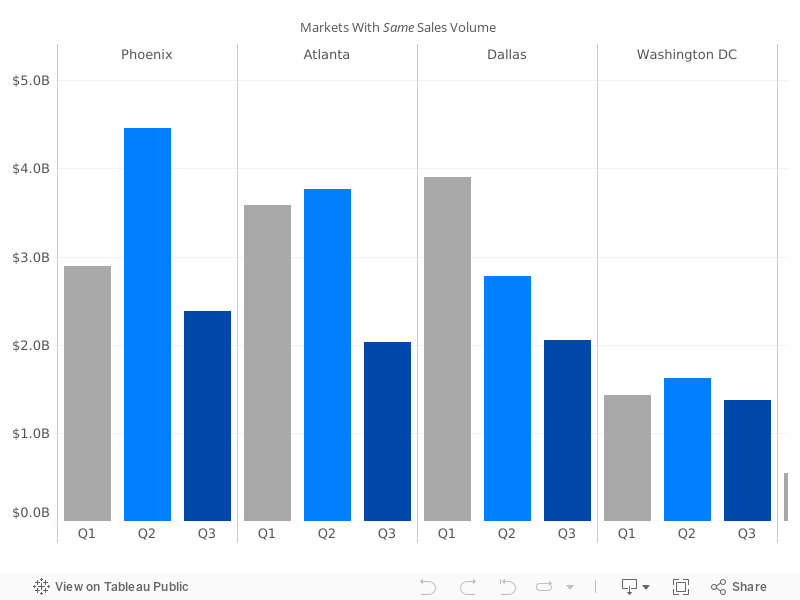
Looking at quarterly sales totals, five of these recorded the strongest sales volumes during the second quarter—the Inland Empire ($833 million), Boston ($1.5 billion), Washington, D.C. ($1.6 billion), Atlanta ($3.8 billion) and Phoenix ($4.5 billion). In the third quarter, the volume dropped below the first quarter’s volume just in Washington, D.C. ($1.4 billion), Atlanta ($2 billion) and Phoenix ($2.4 billion). Dallas is the only market in this segment to have posted a slowdown in sales during the second quarter.
Austin and Dallas had opposite quarterly progressions—in Austin sales increased steadily over the quarters ($723 million in Q1, $822 million in Q2 and $1 billion during Q3), while in Dallas it decreased gradually ($3.9 billion in Q1, $2.8 billion in Q2 and nearly $2.1 billion in Q3).
READ ALSO: Top 10 Multifamily Markets by Sales Volume in 2022 H1
Markets with multifamily investment volumes decreases
The total multifamily investment volume in these four metros during the year’s first three quarters rose to $7.6 billion, accounting for five percent of the national volume, well below the $11.2 billion recorded through the same interval last year. Each of the four metros had different patterns in transaction activity.
Portland and San Diego marked the largest drops in transaction volume, down to half of the corresponding period last year. At $820 million, Portland’s total settled around the figure recorded in 2020 ($729 million), sustained by a strong second quarter which accounted for about half the total volume. In the third quarter though, sales fell below $137 million. San Diego’s figure surpassed the pre-pandemic total ($1.1 billion), posting strong performance during the first two quarters, for $1.3 billion combined. However, during the third quarter, it collapsed to just $34 million.
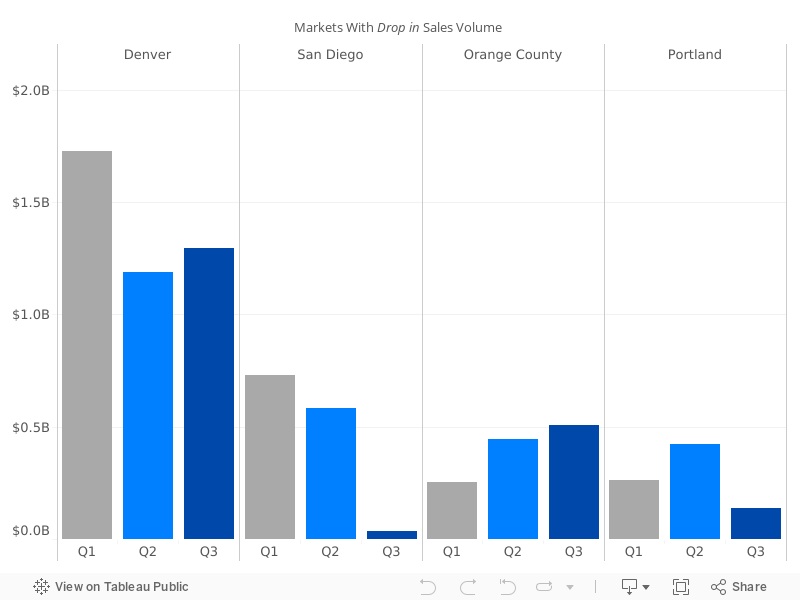
Orange County’s attraction to investors improved by the quarter—from $252 million in the first quarter, to $328 million and $506 million during the second and third quarters, respectively. This metro also shows pandemic-driven growth as, through the third quarter of 2019, only $299 million in multifamily assets had traded; in the following year, that number dropped to less than $134 million. In 2021, it posted a substantial increase to $1.6 billion, while this year through the third quarter it slid 24 percent, to $1.2 billion.
Another metro benefitting from the pandemic’s impact, Denver, led in volume amount with $4.2 billion in multifamily assets traded during 2022’s first three quarters. Although it’s below the $5.5 billion figure registered during the same period last year, it’s still well above the $3.3 billion and $2.7 billion volumes recorded in 2019 and 2020, respectively.