The Impact of Flood Risk on Property Values – A Case Study in Miami
Part I: The Impact of Locations within a Flood Zone
Hurricane Ian landed in Florida on Thursday evening, September 29, 2022. According to CoreLogic, estimated losses from wind and flooding damages to residential and commercial properties in Florida, South Carolina and other impacted states are between $41 billion and $70 billion1. It marked the sixth consecutive year that the U.S. has been impacted by a slow-moving tropical cyclone that produced extreme rainfall and damaging floods: Harvey, Florence, Imelda, Sally, Ida and Ian. A new study also suggested that climate change will increase the risk of flooding by more than 26% by 20502. But what effect does flood risk have on real estate – specifically, a home’s value? How much has the risk been priced in already? How much is not accounted for due to future climate risk?
For a property in a flood zone, buyers typically expect a discount since they must pay expensive insurance and consider the risk of that property being damaged in a storm event. However, a property in a flood zone is also likely to have some desirable amenities that would increase its price, i.e., waterfront or its proximity to the ocean. The challenge is to separate the risk from some confounding factors. Purchasing flood insurance is not mandated to receive a mortgage for a property outside of a 100-year flood zone, as designated by the Federal Emergency Management Agency (FEMA), even though its flood risk is not necessarily zero. For instance, many properties impacted by Hurricane Ian were not insured against floods. Some catastrophe model vendors provide comprehensive flood impact models and risk scores beyond the traditional in or out of a flood zone. If buyers have access to this information, will they incorporate it into their home-buying decision? A recent study suggested home values in flood-prone areas could drop as homebuyers with access to flood-risk data choose to bid on lower-risk homes3.
In this study, we aim to quantify the impact of flood risk on the value of a property in Miami. We selected Miami because it is one of the coastal cities that are most vulnerable to hurricanes. We look at how much the value of a property would change if it were in a flood zone, and in the next blog, we will expand our study using more granular flood risk scores beyond the traditional in/out of flood zone.
The property sale data used in this analysis included all transactions since 2011 in Miami. The data came from the CoreLogic property database including address, sale price, property attributes and geospatial information.
The corresponding flood map can be downloaded online from the FEMA website. A Special Flood Hazard Area (SFHA) is defined as an area that will be inundated by a 1% annual chance of flood, which is also referred to as the base flood or 100-year flood. Figure 1 shows the flood zones for Miami-Dade County. Zone X500 is a 500-year floodplain with a 0.2% of annual chance of flooding. Zone A, AE and AH are 100-year floodplains with a 1% of annual chance of flooding. Zone VE is for coastal areas with a 1% of annual chance of flooding and an additional hazard associated with storm waves. Zone X denotes areas of minimal flood hazard, which are areas outside the SFHA and higher than the elevation of the 0.2% annual chance of flooding.
Figure 1: Miami Flood Zones
Source: CoreLogic, Inc.
© 2022 CoreLogic,Inc., All rights reserved.
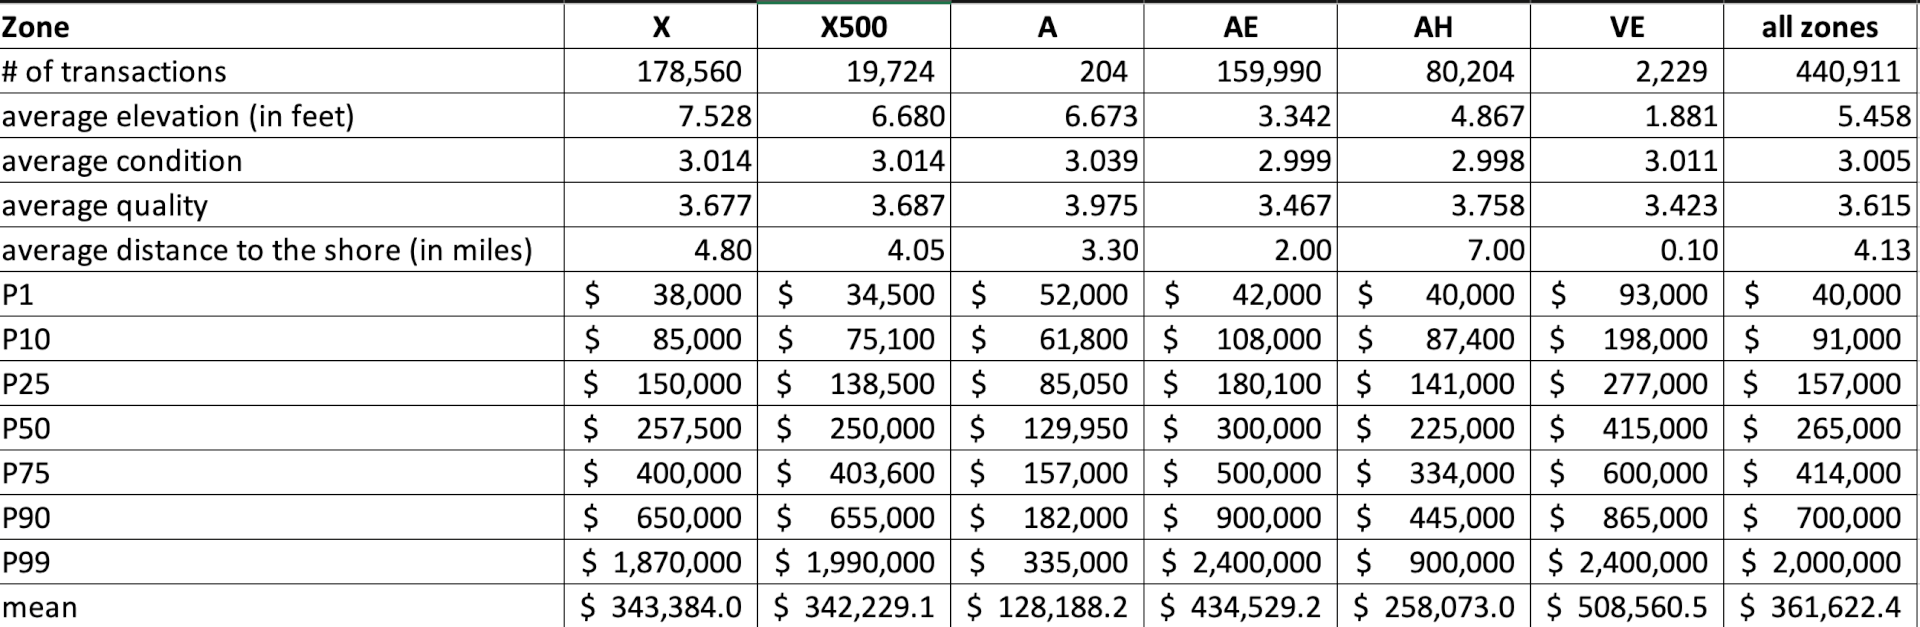
To assign a sale transaction to a flood zone, we used GIS software to join sale data, which has latitude and longitude, with flood zone shape files. Table 1 shows the summary statistics by flood zone. Coastal properties in zone VE have the highest average price as locations close to the ocean demand a premium.
Table 1: summary statistics for sale transactions since 2011 in Miami
A hedonic model was used to regress price/sq.ft. on flood zones/, property attributes, time dimensions and geospatial information to explore the effect of flood risk on property values while controlling for other factors. To capture the premium of a property adjacent to the water, we included the distance to the shore in the regression. CoreLogic proprietary property “condition” and ‘quality’ ratings were also included to capture the condition and quality differences.
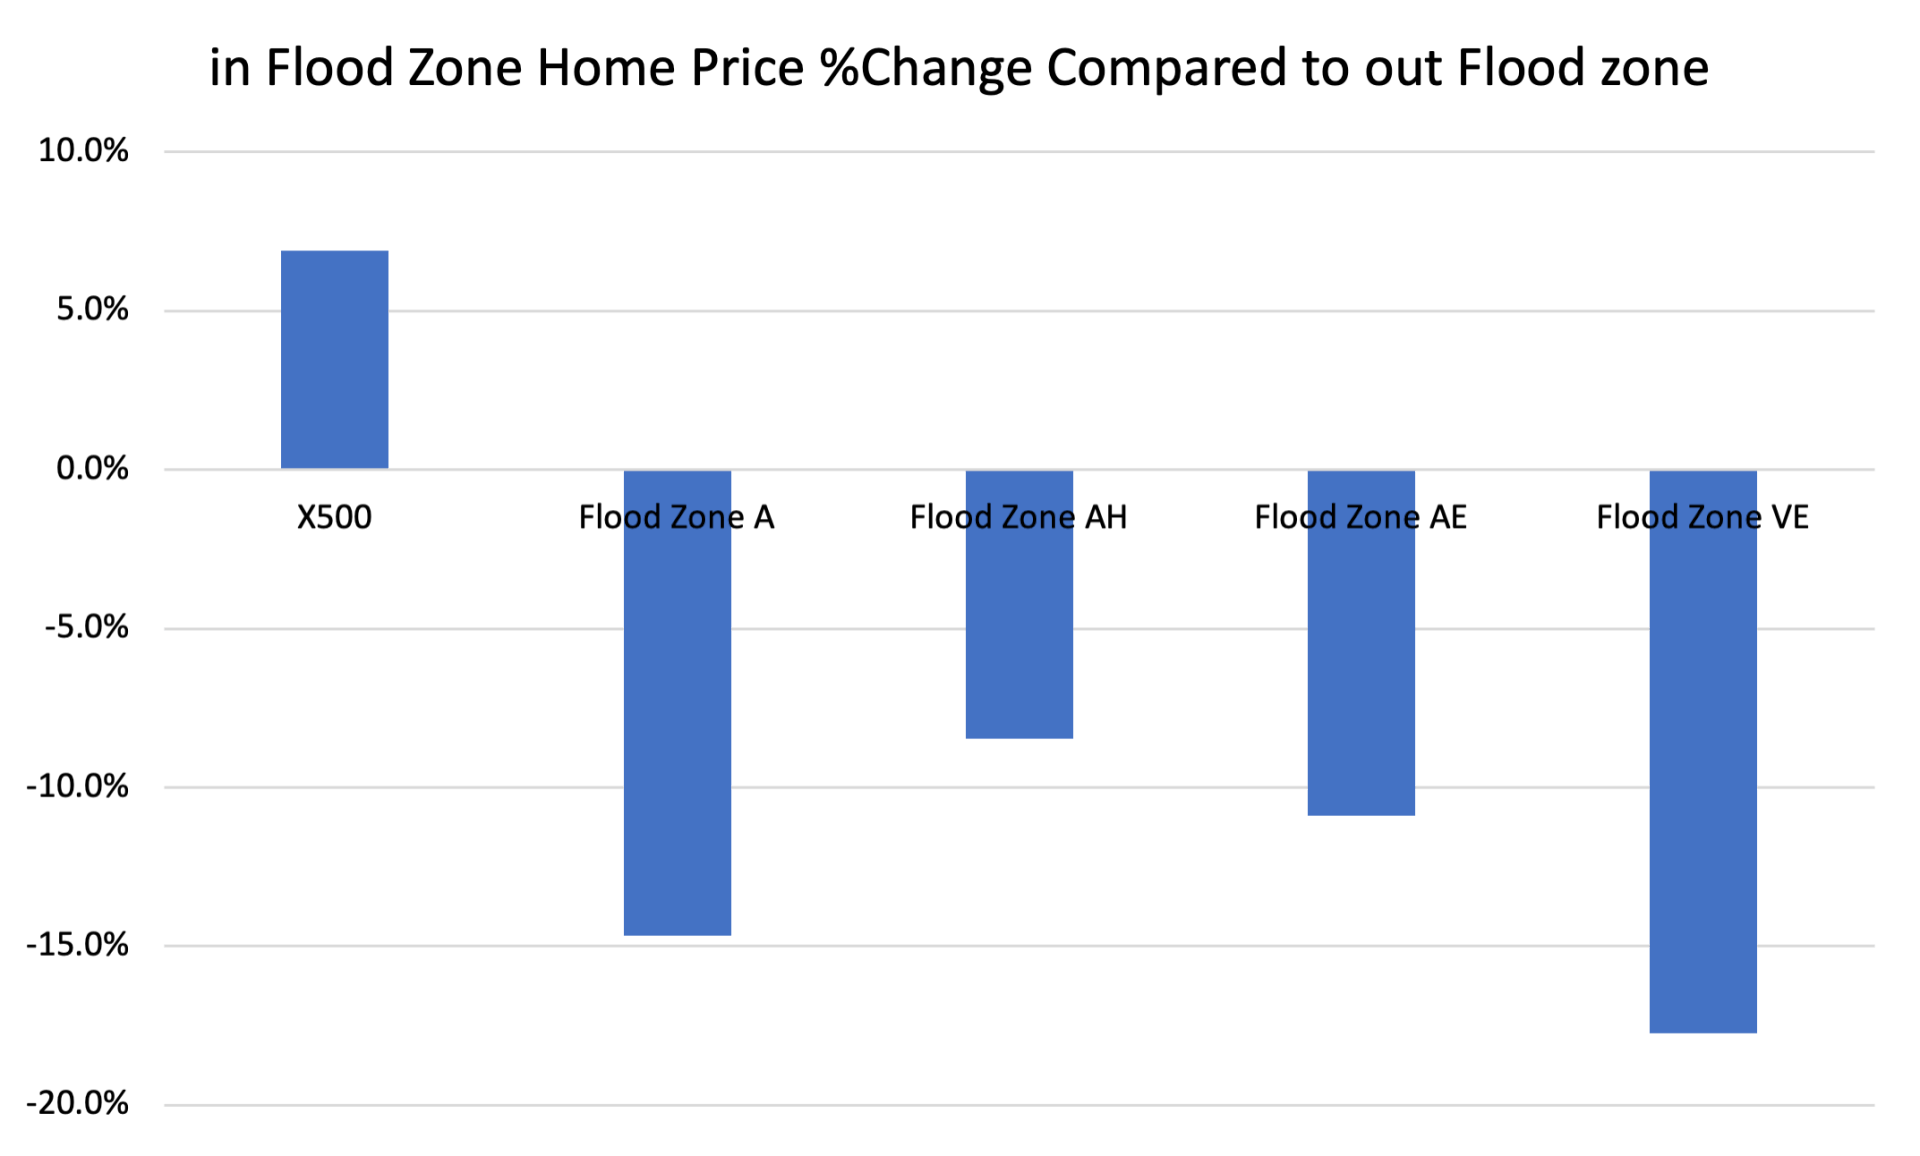
Figure 2 shows the home price percentage change for a property within a flood zone compared to a property outside the flood zone after controlling for factors such as property attributes and location information. Locations within a 100-year flood zone, A, AH, AE or VE, reduce the home price per square foot by 9%-18%. For example, a coastal property in flood zone VE would sell for about 18% less than a similar home in a risk-free zone per square footage. It is worth noting that zone AH and AE result in less reduction in home price than zone A and VE. Zone AH is affected by shallow flooding with an average depth ranging from 1 to 3 feet, and in zone AE, the elevation of the lowest floor in a structure must be at or above the assigned base flood elevation. On average, a flood event in zones AH and AE would cause less damage than in zones A and VE, and buyers appear to be considering this information. Properties in flood zone VE have risks associated with not only flood events but also storm surges, and hence, the highest price reduction. Meanwhile, locations within a 500-year flood zone, X500, increase the price per square footage by about 7%. The average distance to the shore for properties in zone X500 is 4 miles, compared to 4.8 miles for properties in risk-free zone X. It appears the positive impact of being close to water outweighs the low flood risk.
Figure 2: Flood Zone Home Price Premium/Discount
Source: CoreLogic, Inc.
© 2022 CoreLogic,Inc., All rights reserved.
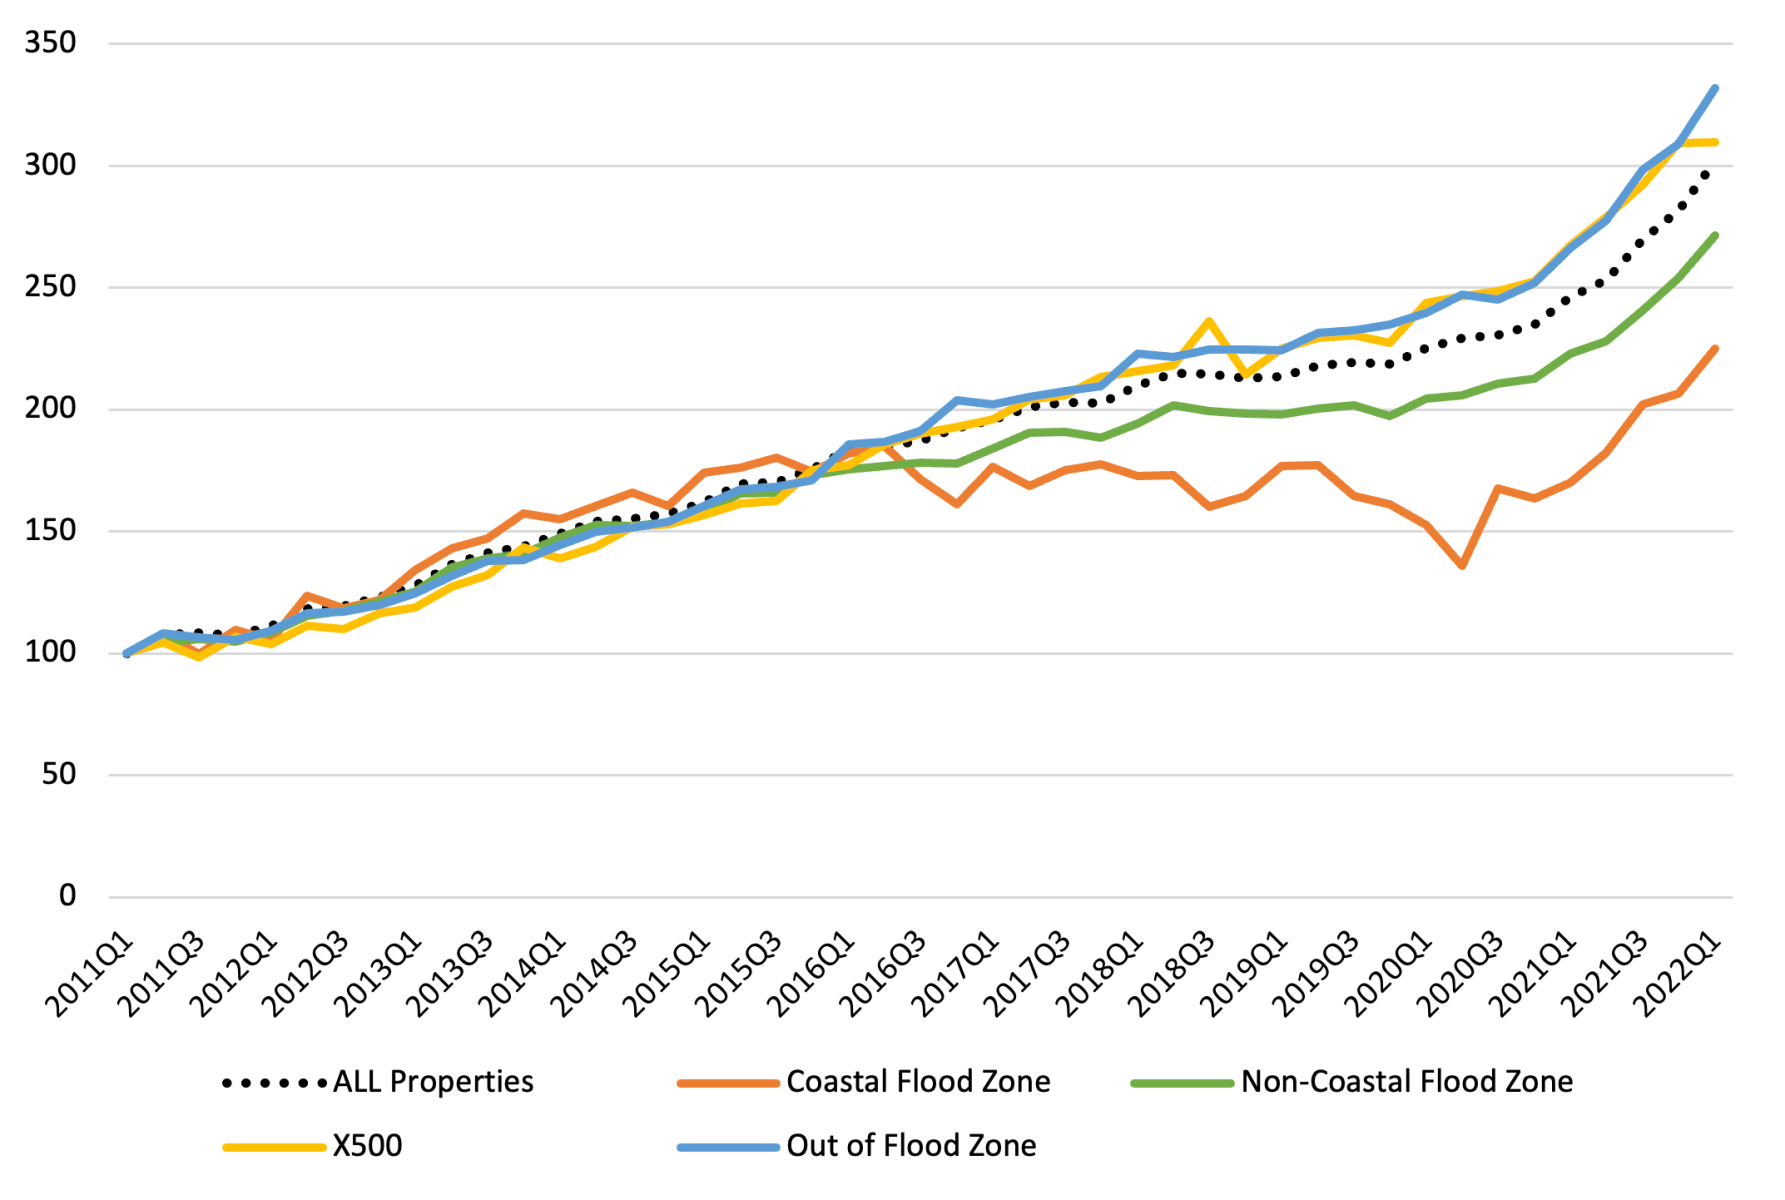
One byproduct of the hedonic regression was a time series of home price indexes that measure property appreciation over time controlling for differences in the quality of housing stock. We ran the regression for individual flood zones to compare how the price might have appreciated differently under different flood risks. Zone A, AE and AH were combined to capture all the non-coastal flood zone properties’ price trends. Figure 3 below shows the home price indexes by flood zone, and it suggests the higher the risk, the slower the appreciation. The price for coastal properties within a flood zone has more than doubled since 2011. Meanwhile, the price for non-coastal properties within a flood zone has almost tripled; properties out of a flood zone registered the highest appreciation since 2011 among all groups – about 330%. The coastal home price appreciated as much as other segments between 2011 and 2016 but remained flat in 2017 and started to decline until it picked up again at the end of 2020. Hurricane Irma hit Florida in Q3 2017 and the damage in the United States was more than $50 billion, which might contribute to the coastal home price decline between 2018 and 2020 as buyers became more cognizant of the negative impact of storms.
Figure 3: Home Price Indexes by Flood Zone – Miami-Date County
Source: CoreLogic, Inc.
© 2022 CoreLogic,Inc., All rights reserved.
The above analysis clearly indicates a property in flood zones sells for less and appreciates slower over time than a similar property outside flood zones, given everything else is equal, in Miami. Is there any way to mitigate the risk and improve the property value? Building homes at a higher elevation will help. Regression results suggested that every foot of elevation can increase home value by 1.6% in a non-coastal flood zone. If not in a flood zone, every mile away from the 100-year floodplain can add 2.2% value to property. Being close to a fire station is another advantage since the fire service provides a vital role in responding to flood events. Further study can be done to evaluate the flood insurance premium versus the discount trend, the first-floor height of the home versus the discount trend, etc. The separation of the trendlines around the year 2016 needs to be explored to understand if there was an event that triggered greater awareness of flood risk in this community. Miami-Dade county is a hurricane-exposed region with a high community awareness of the risks of flooding and further study can answer the question if this trend persists in other communities. Housing is local and buyers may value the proximity to the waterfront differently.
Hurricane Ian was a devastating reminder of the impact one storm could have on homeowners and the importance of having insurance in place to protect your investment.
Jay Liu, Rajendra Anjanappa and Manjunath Halemane contributed to this blog
[1]
[2] Wing, O.E.J., Lehman, W., Bates, P.D. et al. Inequitable patterns of US flood risk in the Anthropocene. Nat. Clim. Chang. 12, 156–162 (2022).
[3]
© 2022 CoreLogic,Inc., All rights reserved.