August Rental Report: Affordability Continues to Worsen

August Highlights
- August 2022 marks the first month in the past 13 months where rent growth has slowed to a single-digit rate for 0-2 bedroom properties (9.8% Y/Y).
- The median asking rent in the 50 largest metros declined to $1,771, cooling from last month’s peak.
- Miami’s leading position in the year-over-year growth rate was surpassed by Chicago, IL (24.9% Y/Y), Boston, MA (22.8% Y/Y), and New York, NY (18.9% Y/Y), for the first time in the past ten months.
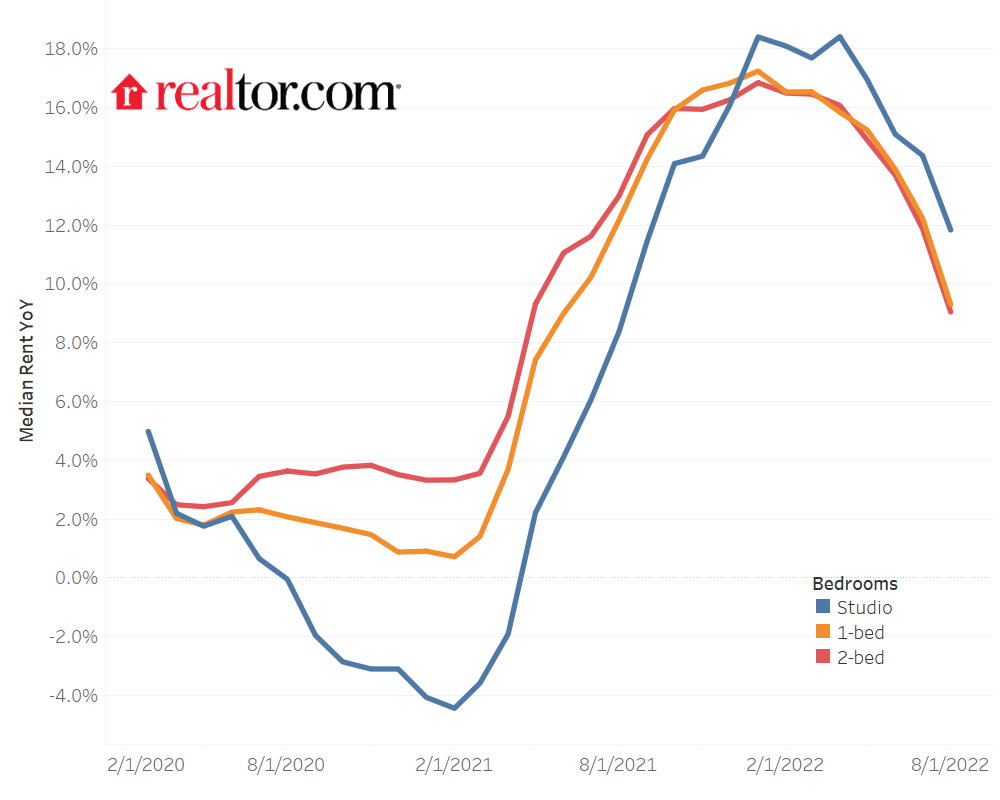
- Studios continued to catch up with double-digit rent increases whereas 1-bedroom and 2-bedroom units experienced single-digit growth. Rent by size: Studio: $1,489, up 11.8% ($158) year-over-year; 1-bed: $1,653, up 9.3% ($141); 2-bed: $1,964, up 9.1% ($163).
Affordability
- In August 2022, rent was less affordable than the previous year. Renters earning the typical household income devoted 26.4% of their income to lease a typical for-rent home (vs. 25.7% in August 2021).
- 9 of the top 50 metros had a rent share higher than 30% relative to the median household income. Miami, FL, was the least affordable rental market in August 2022. The median rent for a typical 0-2 bedroom unit in Miami, FL, is 1.5 times as high as the estimated maximum affordable rent for the median household.
- Oklahoma City, OK, is the most affordable rental market in August 2022. The median rent for a typical 0-2 bedroom unit was 42% lower than its estimated maximum affordable rent.
- With a resurgence in urban rents, rental affordability deteriorated most in the northeast metros such as Boston, MA and New York, NY over the past 12 months.
Rent Dips and Year-over-Year Growth Continues to Slide
In August 2022, the U.S. rental market experienced its first single-digit growth over the past 13 months. The median rent growth across the top 50 metros slowed to 9.8% year-over-year for 0-2 bedroom properties but is still three times as fast as the growth rate seen just before the pandemic hit in March 2020. The median asking rent was $1,771, down by $10 from last month. It is the first time we have seen rents decline since last November, perhaps a sign that more typical seasonal cooling is returning to the rental market, like we’ve seen in recent for-sale data. Despite these encouraging indicators for renters, real affordability challenges persist, and inflation (8.3%) continues to outpace annual wage growth(5.2%), evaporating real gains employees might see from an otherwise strong labor market.
Figure 1: Year-over-Year Rent Trend
Miami, after narrowing its leading year-over-year growth rate in July, for the first time in the past ten consecutive months, was surpassed by Chicago, IL (24.9%), Boston, MA (22.8%), and New York, NY (18.9%). Miami, FL (16.7%) ranked the fourth fastest growing metro in August. Areas with the slowest rent growth were similar to July, with rents increasing the least in Riverside (0.1%), Phoenix (2.1%), Las Vegas, NV (2.3%), Minneapolis (3.1%), and Sacramento (3.2%).
Studio Rents Continue to Catch Up as Growth Cools for All Unit Sizes
In August, two-bedroom units saw a single-digit growth rate for the first time in the past 14 months, and the median rent has cooled from last month’s peak, down by $20. The median rent for two bedrooms was $1,964 nationally, $163 (9.1%) higher than the same time last year and up by $370 (23.2%) compared to two years ago.
Rent growth for one-bedroom also cooled down to a single-digit rate in August for the first time in the past 13 months. The median rent for 1-bedroom units was $1,653, down by $2 compared to last month, but up by $141 (9.3%) compared to the previous year and 22.6% ($305) higher since August 2020.
While studios kept growing faster than 1-bedroom and 2-bedroom units, they mirrored the cooling trend seen in larger units. In August 2022, the median rent for studio units was $1,489, down by $9 compared to last month. Nevertheless, it was still up by $158 (11.8%) year-over-year and $261 (21.2%) higher than two years ago.
Table 1: National Rents by Unit Size
| Unit Size | Median Rent | Rent YoY | Rent Change – 2 years |
| Overall | $1,771 | 9.8% | 22.8% |
| Studio | $1,489 | 11.8% | 21.2% |
| 1-bed | $1,653 | 9.3% | 22.6% |
| 2-bed | $1,964 | 9.1% | 23.2% |
Figure 2: National Rent Trend by Unit Size
Rental Affordability Worsens
While annual rent growth is cooling, affordability concerns are still rising. According to Fannie Mae’s National Housing Survey, in August, nearly 88% of respondents believed home rental prices will not improve in the next 12 months, which is actually a slightly more optimistic outlook than renters have had recently. This outlook also helps explain recent survey findings from Realtor.com’s Avail which highlights the financial strain rent & other housing costs are causing.
One approach to measuring rental affordability is the 30-percent rule of thumb. According to this principle, a household should spend no more than 30 percent of its income on housing costs. The U.S. Department of Housing and Urban Development (HUD) uses this approach. HUD defines cost-burdened households as those paying more than 30 percent of income on housing (including utilities) and severely cost-burdened households as those paying more than 50 percent of income on rent (including utilities).
This report uses a Rent Share of Income to measure rental affordability in August 2022. It compares the median monthly rents to the estimated median monthly household income. A higher value means that rental costs make up a more significant proportion of family income every month, indicating a relatively less affordable rental market. Meanwhile, a lower share implies a much healthier housing environment.
In 2021, the average median monthly household income among the top 50 metros was $6,277 and the monthly median listed rent for rental units with 0-2 bedrooms was $1,553, suggesting rents made up 24.7% of a typical household income. In August 2022, the rent share was 26.4% (vs. 25.7% in August 2021), showing that the nation’s rental affordability has worsened.
Coastal Markets See Lowest Affordability
In August 2022, 9 of the top 50 metros had a rent share higher than 30% relative to the median household income. The least affordable rental market was Miami, FL, followed by coastal or Sun Belts metros like Los Angeles, CA, San Diego, CA, Riverside, CA, Tampa, FL, New York, NY, Boston, MA, Orlando, FL, and Providence, RI. In addition, affordability has worsened in 7 of the 9 markets as the current rent share of income is higher than this time last year and all 9 of them are higher than the average for 2021 as a whole. Specifically, families looking to rent with a typical household income in Miami, FL, would spend 46.5% of their monthly paycheck on the typical rental in August 2022, a hike of 3.4 percentage points over 12 months ago. Put another way, the median rent for a typical 0-2 bedroom unit in Miami, FL, is 1.6 times as high as its estimated affordable rent, which limits rent to just 30% of the current typical household income.
Table 2: Rental Markets with a Rental Burden Above 30% of Income (0-2 Bedrooms)-August 2022
| Rank | Metros | August 2022 Median Rent | August 2022 Rent Share | August 2021 Rent Share | Overall 2021 Rent Share | Maximum Affordable Rent at Current HH Income |
| 1 | Miami-Fort Lauderdale-West Palm Beach, FL | $2,626 | 46.5% | 43.1% | 37.2% | $1,692 |
| 2 | Los Angeles-Long Beach-Anaheim, CA | $2,946 | 40.7% | 40.2% | 35.5% | $2,170 |
| 3 | San Diego-Carlsbad, CA | $2,888 | 37.1% | 36.0% | 31.3% | $2,338 |
| 4 | New York-Newark-Jersey City, NY-NJ-PA | $2,807 | 36.3% | 32.8% | 30.4% | $2,318 |
| 5 | Boston-Cambridge-Newton, MA-NH | $3,040 | 35.1% | 30.7% | 28.0% | $2,596 |
| 6 | Tampa-St. Petersburg-Clearwater, FL | $1,789 | 32.9% | 33.9% | 29.4% | $1,630 |
| 7 | Riverside-San Bernardino-Ontario, CA | $2,107 | 32.4% | 35.4% | 30.8% | $1,953 |
| 8 | Orlando-Kissimmee-Sanford, FL | $1,842 | 32.0% | 30.1% | 26.4% | $1,730 |
| 9 | Providence-Warwick, RI-MA | $2,035 | 31.9% | 29.9% | 27.2% | $1,916 |
Middle-America Markets Have Greater Affordability
Meanwhile, Oklahoma City, OK, was the most affordable rental market in August. Its median rent for a typical 0-2 bedroom unit was 42% lower than its estimated affordable rent under the current median household income. Other affordable rental markets include Minneapolis, MN, St. Louis, MO, Kansas City, KS, and Louisville/Jefferson County, KY. Nevertheless, affordability has declined over the past year for these metros because the recent rent shares of 7 out of 9 metros were higher than 12 months ago and all 9 of them are higher than the average for 2021 as a whole. In other words, even in these areas where rents are more affordable, rents are growing faster than incomes and taking up a larger share of paychecks than before.
Table 3. Top 10 Most Affordable Rental Markets (0-2 Bedrooms)-August 2022
| Rank | Metros | August 2022 Median Rent | August 2022 Rent Share | August 2021 Rent Share | Overall 2021 Rent Share | Maximum Affordable Rent at Current HH Income |
| 1 | Oklahoma City, OK | $973 | 17.5% | 16.7% | 14.9% | $1,671 |
| 2 | Minneapolis-St. Paul-Bloomington, MN-WI | $1,545 | 20.1% | 20.8% | 19.1% | $2,302 |
| 3 | St. Louis, MO-IL | $1,246 | 20.3% | 20.0% | 18.5% | $1,843 |
| 4 | Kansas City, MO-KS | $1,306 | 20.6% | 19.5% | 18.0% | $1,904 |
| 5 | Louisville/Jefferson County, KY-IN | $1,158 | 20.6% | 19.1% | 18.1% | $1,687 |
| 6 | Columbus, OH | $1,280 | 20.7% | 20.2% | 18.3% | $1,857 |
| 7 | Cincinnati, OH-KY-IN | $1,313 | 21.3% | 20.6% | 18.8% | $1,848 |
| 8 | Indianapolis-Carmel-Anderson, IN | $1,284 | 21.7% | 21.0% | 18.9% | $1,775 |
| 9 | Birmingham-Hoover, AL | $1,194 | 21.9% | 20.7% | 19.5% | $1,634 |
| 10 | Houston-The Woodlands-Sugar Land, TX | $1,391 | 22.3% | 22.5% | 20.3% | $1,871 |
Renters Pay Up for Big Cities, Outstripping the Wage Premium
Housing affordability continues to be a major challenge in northeastern markets. In August, Realtor.com’s “America’s Hottest Zip Codes of 2022” report revealed that homebuyers fled from the expensive northeast metros (Boston, NY, DC) to nearby towns and suburbs to find affordable homeownership. Like homebuyers, renters in the northeast market also face escalating affordability concerns. In August 2022, Boston, MA, and New York, NY, are the metros seeing the biggest growth in rent-to-income share. During the past 12 months, Boston’s rent share hiked from 30.7% to 35.1%, and the share in New York jumped from 32.8% to 36.3%. New England metros such as Hartford, CT, and Providence, RI, also experienced large rent burden increases, rising from 21.9% to 24.2% and 30.0% to 31.9%, respectively.
Table 4. Rental Markets with Most Deteriorated Affordability (0-2 Bedrooms)-August 2022
| Metro Areas | August 2022 Median Rent | August 2022 Rent Share | August 2021 Rent Share | Overall 2021 Rent Share |
| Boston-Cambridge-Newton, MA-NH | $3,040 | 35.1% | 30.7% | 28.0% |
| Chicago-Naperville-Elgin, IL-IN-WI | $2,061 | 29.7% | 25.8% | 23.5% |
| New York-Newark-Jersey City, NY-NJ-PA | $2,807 | 36.3% | 32.8% | 30.4% |
| Miami-Fort Lauderdale-West Palm Beach, FL | $2,626 | 46.5% | 43.1% | 37.2% |
| Hartford-West Hartford-East Hartford, CT | $1,661 | 24.2% | 21.9% | 22.1% |
Appendix: Rental Data – 50 Largest Metropolitan Areas –August 2022
| Metro | Overall Median Rent | Overall Rent YY | Studio Median Rent | Studio Rent YY | 1-br Median Rent | 1-br Rent YY | 2-br Median Rent | 2-br Rent YY |
| Atlanta-Sandy Springs-Roswell, GA | 1,760 | 4.2% | 1,706 | 7.8% | 1,659 | 3.8% | 1,892 | 2.5% |
| Austin-Round Rock, TX | 1,765 | 9.5% | 1,532 | 16.1% | 1,617 | 8.7% | 1,959 | 8.8% |
| Baltimore-Columbia-Towson, MD | 1,790 | 6.4% | 1,591 | 6.6% | 1,701 | 6.2% | 1,912 | 7.5% |
| Birmingham-Hoover, AL | 1,194 | 9.6% | 965 | -9.8% | 1,137 | 8.1% | 1,230 | 10.2% |
| Boston-Cambridge-Newton, MA-NH | 3,040 | 22.8% | 2,796 | 31.6% | 2,787 | 18.6% | 3,384 | 26.0% |
| Buffalo-Cheektowaga-Niagara Falls, NY | 1,291 | 8.0% | 840.07 | 1.8% | 1,188 | 11.3% | 1,478 | 9.3% |
| Charlotte-Concord-Gastonia, NC-SC | 1,631 | 7.9% | 1,570 | 14.5% | 1,537 | 10.2% | 1,753 | 5.4% |
| Chicago-Naperville-Elgin, IL-IN-WI | 2,061 | 24.9% | 1,761 | 52.8% | 1,988 | 24.1% | 2,276 | 21.1% |
| Cincinnati, OH-KY-IN | 1,313 | 11.1% | 1,182 | 11.0% | 1,252 | 10.4% | 1,352 | 6.3% |
| Cleveland-Elyria, OH | 1,236 | 11.8% | 917.99 | 15.5% | 1,187 | 11.2% | 1,385 | 15.1% |
| Columbus, OH | 1,280 | 9.2% | 1,058 | 5.8% | 1,207 | 9.7% | 1,356 | 7.1% |
| Dallas-Fort Worth-Arlington, TX | 1,609 | 11.4% | 1,400 | 11.3% | 1,497 | 12.7% | 1,891 | 10.3% |
| Denver-Aurora-Lakewood, CO | 1,977 | 5.1% | 1,632 | 2.1% | 1,842 | 4.1% | 2,289 | 5.5% |
| Detroit-Warren-Dearborn, MI | 1,302 | 8.7% | 1,130 | 14.8% | 1,145 | 10.4% | 1,435 | 6.7% |
| Hartford-West Hartford-East Hartford, CT | 1,661 | 10.8% | 1,404 | 24.6% | 1,487 | 5.1% | 1,915 | 12.6% |
| Houston-The Woodlands-Sugar Land, TX | 1,391 | 7.4% | 1,309 | 4.1% | 1,280 | 7.7% | 1,537 | 5.8% |
| Indianapolis-Carmel-Anderson, IN | 1,284 | 10.7% | 1,099 | 9.9% | 1,212 | 13.2% | 1,398 | 7.7% |
| Jacksonville, FL | 1,474 | 5.5% | 1,199 | 18.3% | 1,373 | 4.8% | 1,575 | 3.5% |
| Kansas City, MO-KS | 1,306 | 11.7% | 954.88 | 2.4% | 1,234 | 13.5% | 1,512 | 12.0% |
| Las Vegas-Henderson-Paradise, NV | 1,541 | 2.3% | 1,019 | 12.2% | 1,429 | 3.2% | 1,643 | 0.1% |
| Los Angeles-Long Beach-Anaheim, CA | 2,946 | 10.1% | 2,345 | 14.8% | 2,716 | 8.8% | 3,434 | 7.6% |
| Louisville/Jefferson County, KY-IN | 1,158 | 12.8% | 1,023 | 16.2% | 1,091 | 11.0% | 1,232 | 9.8% |
| Memphis, TN-MS-AR | 1,336 | 10.3% | 1,206 | 11.2% | 1,313 | 9.9% | 1,373 | 9.8% |
| Miami-Fort Lauderdale-West Palm Beach, FL | 2,626 | 16.7% | 2,227 | 20.3% | 2,355 | 17.7% | 2,933 | 15.3% |
| Milwaukee-Waukesha-West Allis, WI | 1,538 | 8.7% | 1,197 | 9.4% | 1,423 | 9.2% | 1,757 | 6.6% |
| Minneapolis-St. Paul-Bloomington, MN-WI | 1,545 | 3.1% | 1,203 | 0.3% | 1,459 | 1.9% | 1,850 | 1.4% |
| Nashville-Davidson–Murfreesboro–Franklin, TN | 1,697 | 10.8% | 1,645 | 4.6% | 1,630 | 10.8% | 1,777 | 13.0% |
| New Orleans-Metairie, LA | 1,391 | 7.8% | NA | NA | NA | NA | NA | NA |
| New York-Newark-Jersey City, NY-NJ-PA | 2,807 | 18.9% | 2,553 | 22.3% | 2,498 | 15.0% | 3,107 | 16.2% |
| Oklahoma City, OK | 973.45 | 14.9% | 866.57 | 23.8% | 827.65 | 10.4% | 1,050 | 17.4% |
| Orlando-Kissimmee-Sanford, FL | 1,842 | 13.8% | 1,636 | 13.1% | 1,731 | 14.4% | 2,056 | 13.3% |
| Philadelphia-Camden-Wilmington, PA-NJ-DE-MD | 1,767 | 8.4% | 1,466 | 14.1% | 1,716 | 7.9% | 1,889 | 3.4% |
| Phoenix-Mesa-Scottsdale, AZ | 1,647 | 2.1% | 1,299 | 4.1% | 1,543 | 2.2% | 1,784 | -1.2% |
| Pittsburgh, PA | 1,524 | 9.3% | 1,373 | 11.0% | 1,498 | 10.5% | 1,552 | 2.9% |
| Portland-Vancouver-Hillsboro, OR-WA | 1,847 | 9.1% | 1,463 | 5.7% | 1,760 | 7.9% | 2,101 | 9.9% |
| Providence-Warwick, RI-MA | 2,035 | 15.8% | NA | NA | NA | NA | NA | NA |
| Raleigh, NC | 1,651 | 12.2% | 1,515 | 10.9% | 1,536 | 12.8% | 1,803 | 9.4% |
| Richmond, VA | 1,405 | 9.4% | 1,260 | 15.6% | 1,321 | 12.4% | 1,549 | 7.6% |
| Riverside-San Bernardino-Ontario, CA | 2,107 | 0.1% | 1,321 | -6.2% | 1,905 | 1.1% | 2,401 | 0.8% |
| Rochester, NY | 1,309 | 8.8% | 1,094 | 25.8% | 1,206 | 10.9% | 1,507 | 12.9% |
| Sacramento–Roseville–Arden-Arcade, CA | 1,955 | 3.2% | 1,550 | -7.2% | 1,788 | 1.3% | 2,065 | 3.4% |
| San Antonio-New Braunfels, TX | 1,294 | 9.8% | 1,041 | 0.4% | 1,216 | 10.6% | 1,466 | 8.5% |
| San Diego-Carlsbad, CA | 2,888 | 11.5% | 2,339 | 11.5% | 2,719 | 10.7% | 3,221 | 11.4% |
| San Francisco-Oakland-Hayward, CA | 3,134 | 8.6% | 2,629 | 10.5% | 2,860 | 6.5% | 3,655 | 9.6% |
| San Jose-Sunnyvale-Santa Clara, CA | 3,353 | 11.9% | 2,675 | 11.7% | 3,111 | 11.7% | 3,780 | 11.3% |
| Seattle-Tacoma-Bellevue, WA | 2,195 | 6.8% | 1,820 | 9.9% | 2,173 | 5.1% | 2,504 | 9.1% |
| St. Louis, MO-IL | 1,246 | 8.1% | 992.78 | 4.4% | 1,201 | 6.7% | 1,316 | 6.1% |
| Tampa-St. Petersburg-Clearwater, FL | 1,789 | 4.6% | 1,753 | 11.3% | 1,668 | 3.4% | 1,929 | 1.5% |
| Virginia Beach-Norfolk-Newport News, VA-NC | 1,417 | 5.5% | 1,285 | 10.7% | 1,382 | 5.2% | 1,451 | 1.2% |
| Washington-Arlington-Alexandria, DC-VA-MD-WV | 2,199 | 8.0% | 1,815 | 8.6% | 2,099 | 7.8% | 2,547 | 6.1% |
Methodology
Rental data as of August for units advertised as for-rent on Realtor.com®. Rental units include apartment communities as well as private rentals (condos, townhomes, single-family homes). All units were studio, 1-bedroom, or 2-bedroom units. We use communities that reliably report data each month within the top 50 largest metropolitan areas. National rents were calculated by averaging the medians of the 50 largest metropolitan areas.Realtor.com® began publishing regular monthly rental trends reports in October 2020 with data history stretching back to March 2019.
With the release of its August 2022 rent report, Realtor.com® incorporated a new and improved methodology for capturing and reporting more comprehensive rental listing trends and metrics. The new methodology is expected to yield a cleaner, more representative and more consistent measurement of rental listings and trends at both the national and local level. The methodology has been adjusted to better represent the true cost of primary housing for renters. Most areas across the country will see minor changes with a smaller handful of areas seeing larger updates. As a result of these changes, the rental data released since September 2022 will not be directly comparable with previous releases (files downloaded before September 2022) and Realtor.com® economics blog posts. However, future data releases, including historical data, will consistently apply the new methodology.
Rental affordability analysis: The affordable monthly rent is calculated by applying the 30% rule to the estimated 2022 monthly median household income nationwide ($6,716 across the 50 largest U.S. metros, on average) and in each metro. The monthly median household income is derived from the annual median household income data sourced from Claritas. Due to the methodology changes noted below, Realtor.com has made historical revisions to its prior affordability analyses. For our most recently published affordability analysis on February 2022 data published in March 2022, the national rent-to-income share has been updated to 25.0%.

Subscribe to our mailing list to receive monthly updates and notifications on the latest data and research.
 Jiayi Xu,
![]() Danielle Hale
Danielle Hale