Expected goals: Which goalkeepers are most helping or hurting teams in 2022?
The graph below illustrates how all MLS goalkeepers (minimum 270 minutes played) have performed this season when analyzing the difference between expected vs. conceded goals.
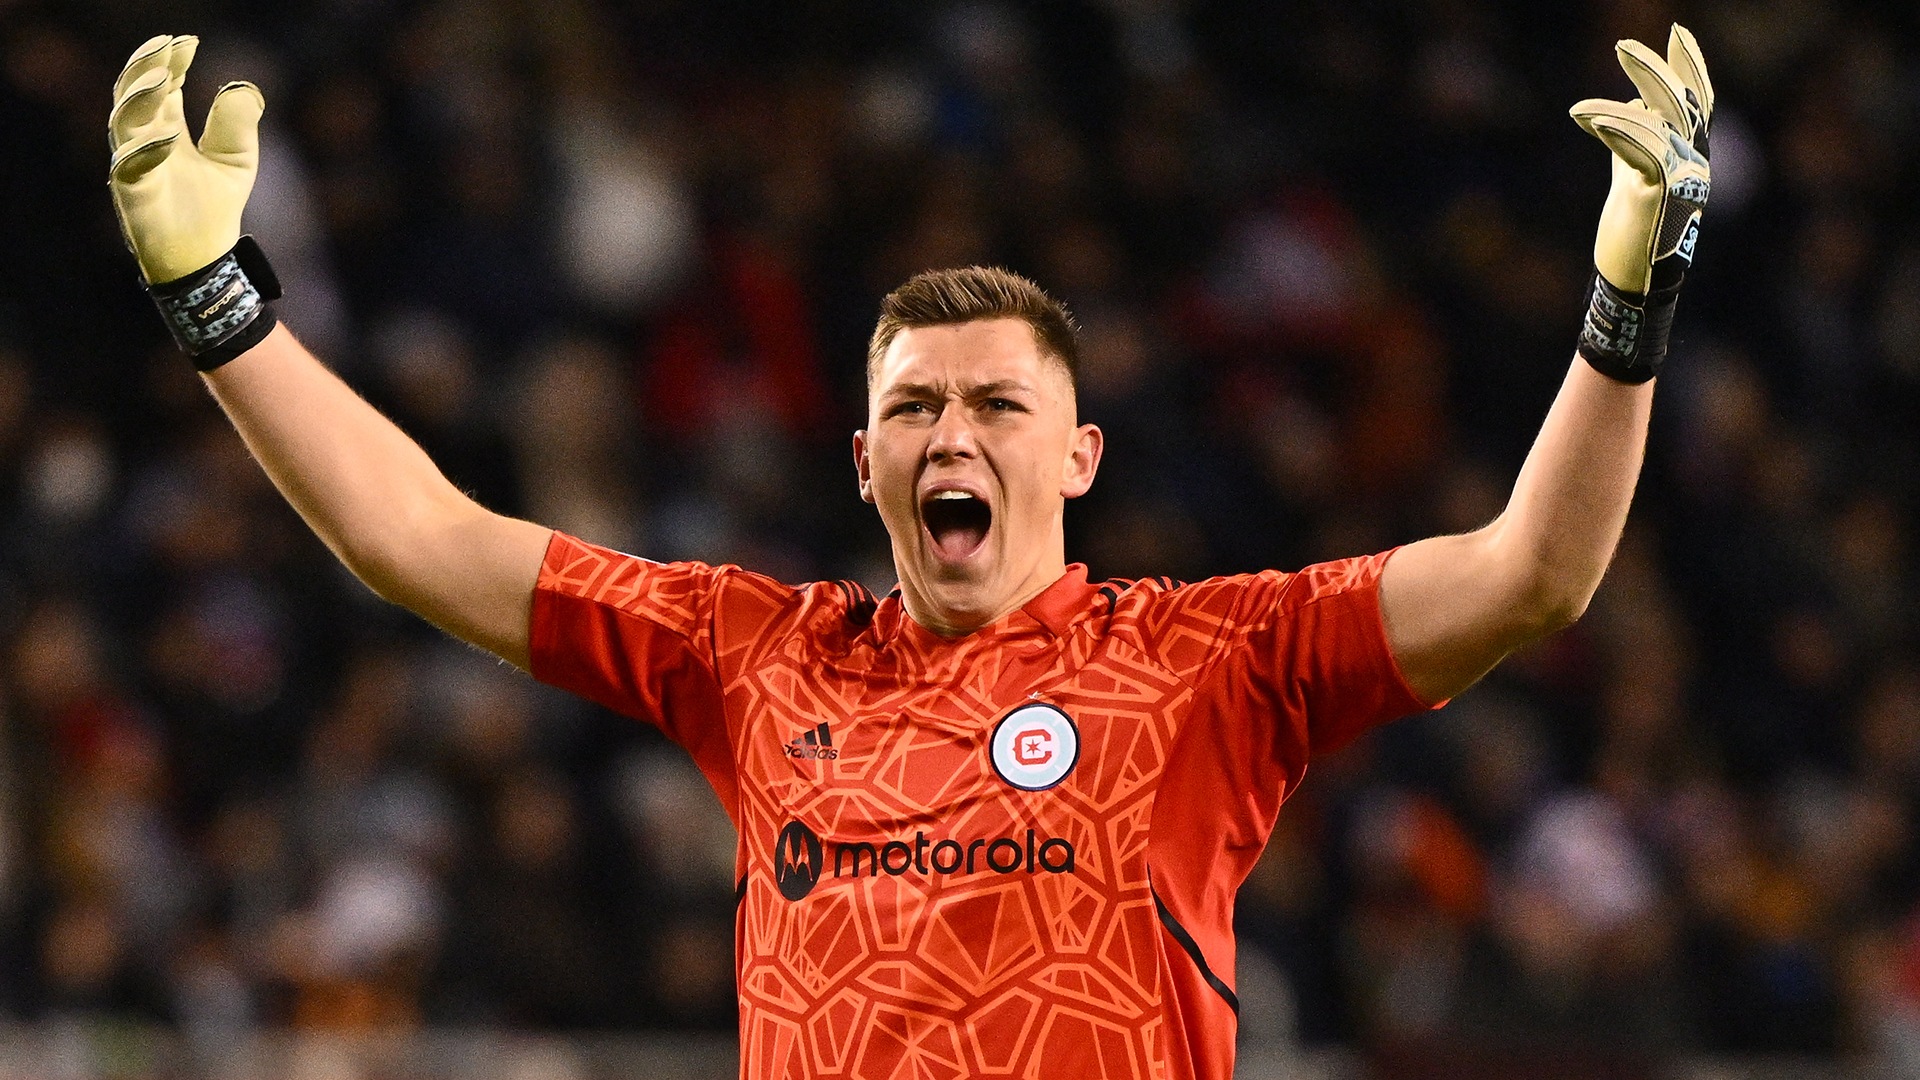
The first half of the chart (green) reflects the keepers who have overperformed their expected goals and have displayed excellent shot-stopping through the first seven weeks of the season (i.e. Slonina). The bottom half (red) displays goalies who have underperformed (i.e. Breza), according to Opta’s data.


