
November 2022 Housing Market Trends Report
- The national inventory of active listings increased by 46.8% over last year, increasing more than 13 percentage points over the previous month, the largest month-over-month increase in this growth rate since May 2022 when inventory first saw a positive annual growth rate.
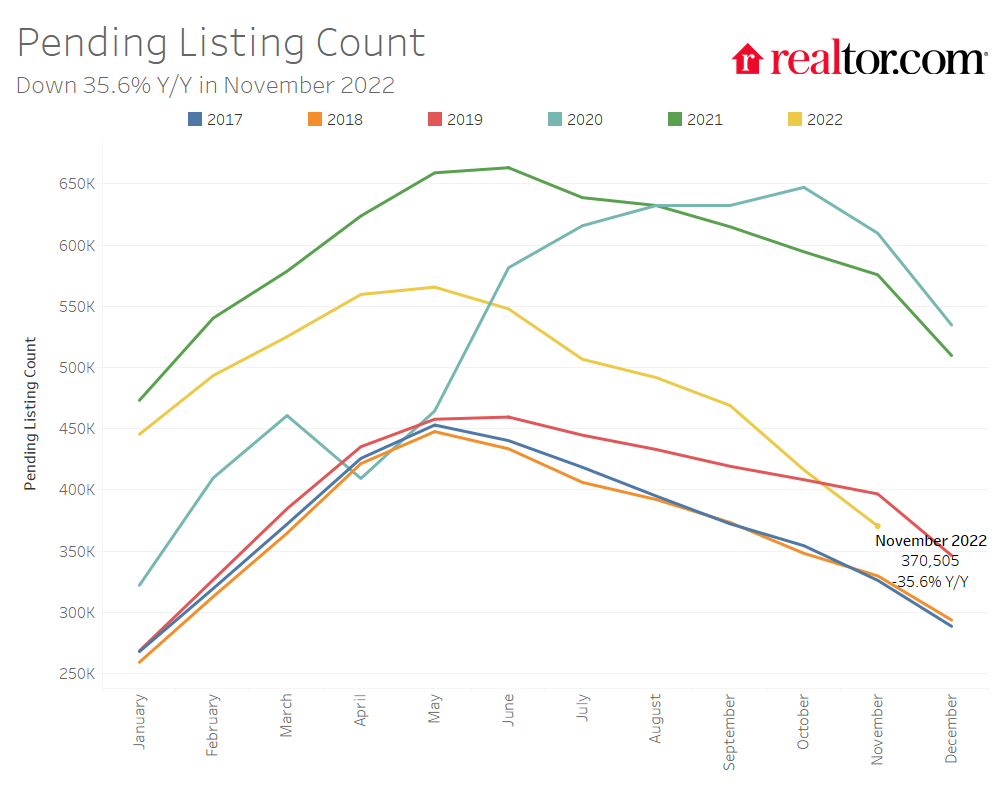
- The total inventory of unsold homes, including pending listings, increased by just 3.0% year-over-year due to a decline in pending inventory (-35.6%).
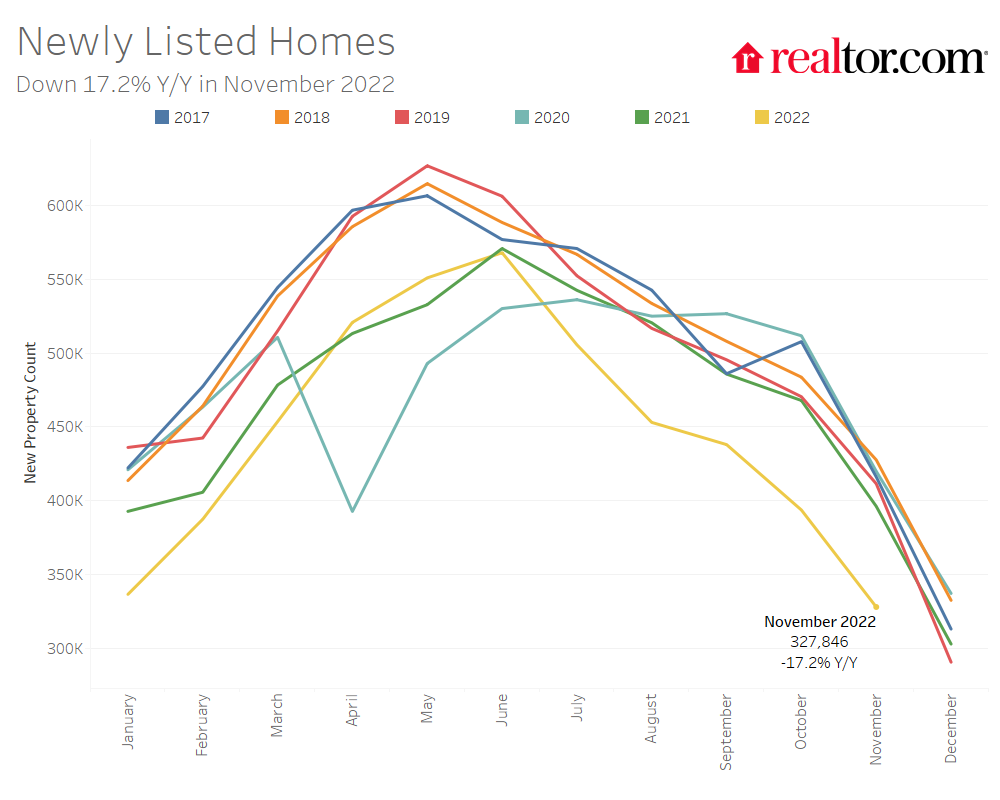
- Sellers are less active than last year, as newly listed homes declined by 17.2% on a year-over-year basis.
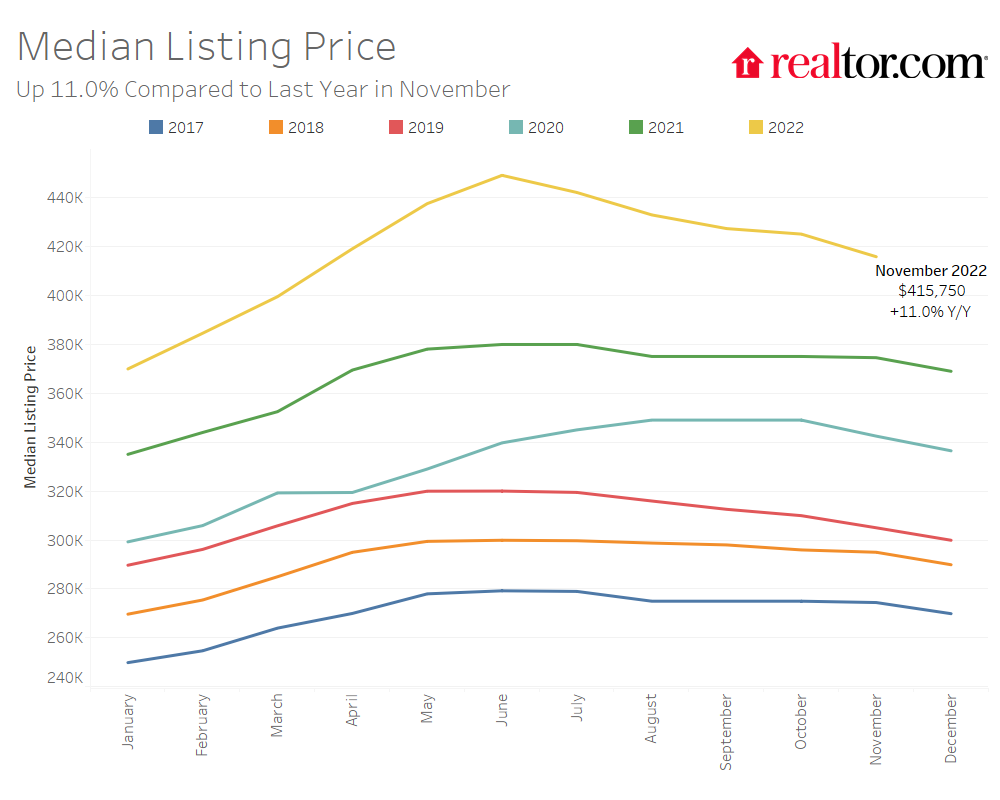
- The median list price grew by 11.0% in November and is decelerating from higher growth rates in recent months.
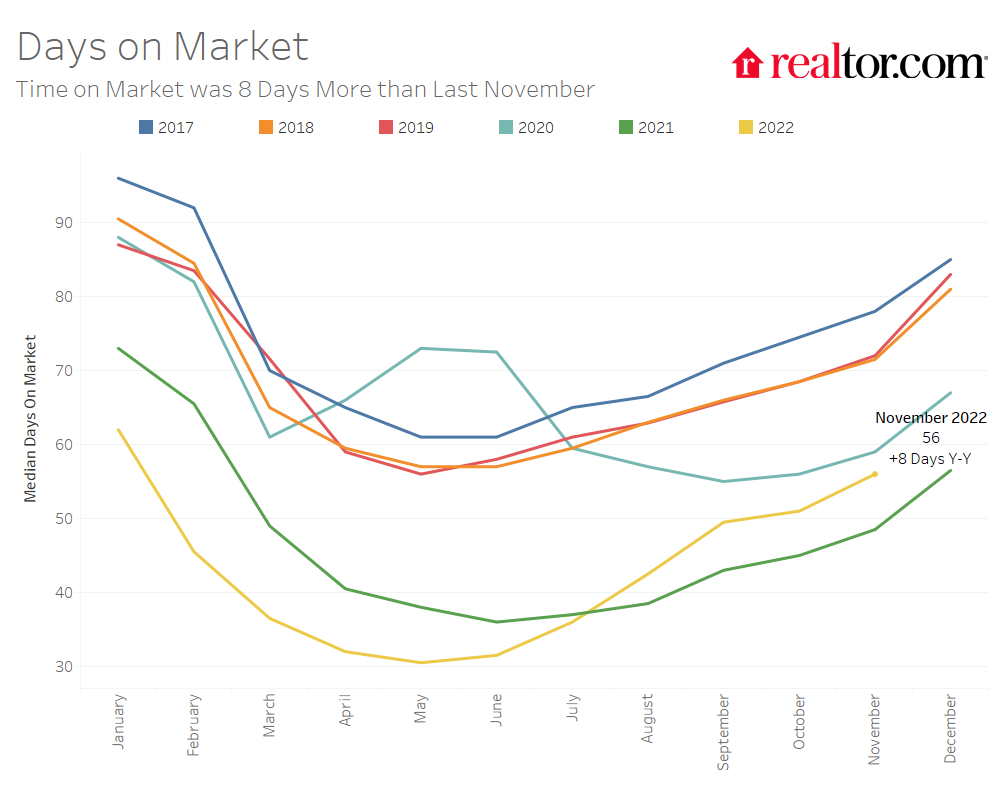
- Time on market was 56 days, 8 days more than last year but 18 days less than typical pre-pandemic levels.
Realtor.com®’s November housing data release reveals a housing market that continued to cool, with rising inventory levels, fewer pending listings, a slower pace of sales, and slowing price growth. The inventory of homes for sale has surpassed 2020-levels but continues to fall short of pre-pandemic levels in all regions except for the West, where inventory may reach 2019-levels as soon as next month.
Pending Home Listings Drop Below Pre-Pandemic Levels
Nationally, the inventory of homes actively for sale on a typical day in November increased by 46.8% over the past year. This amounted to 240,000 more homes actively for sale on a typical day in November compared to the previous year. The growth rate of inventory increased compared to last month’s growth rate of 33.5%, when it had just surpassed 2020 levels, but inventory remains 38.1% below typical pre-pandemic 2017 to 2019 levels. The year-over-year growth rate increased by more than 13 percentage points over last month, the largest month-over-month increase in this growth rate since May 2022 when inventory first saw a positive growth compared to the previous year.

The total number of unsold homes nationwide—a metric that includes both active listings and listings in various stages of the selling process that are not yet sold—increased by only 3.0% year-over-year. Growth accelerated from last month’s 0.5% growth rate but remains low because the count of pending listings and newly listed homes fell further on a year-over-year basis.

The total inventory of homes for sale includes homes in pending status, which are those listings in various stages of the selling process that are not yet sold. The inventory of pending listings on a typical day has declined by 35.6% compared to last November. This is a further deceleration from the 30.0% annual decline we reported for October and the count of pending listings has declined below pre-pandemic 2019 levels for the first time. The decline in buyer demand has been spurred by rising interest rates and continuously growing home list prices that have increased the cost of financing 80% of the typical home by nearly $900 each month or 70.4% compared to a year ago, far outpacing recent rent growth (4.7%) and inflation (7.7%).
In November, newly listed homes declined by 17.2% compared to the same time last year, a greater rate of decline compared to last month’s 15.9% year-over-year decrease. In October, seller sentiment declined and remained well below last year’s levels. Fannie Mae’s Home Purchase Sentiment Index (HPSI) revealed that the net share of respondents saying now is a good time to sell decreased by 8 percentage points compared to the previous month and by 26 percentage points compared to last year. The HPSI survey also revealed that the net share of Americans who believe home prices will go up over the next 12 months decreased by 2 percentage points in October compared to the previous month and by 15 percentage points compared to last year.
The inventory of homes actively for sale in the 50 largest U.S. metros overall increased by 62.8% over last year in November, outpacing the national growth rate. In the West, active listings grew most (by +93.7% year-over-year), closely followed by the South (+89.3%), with the Midwest and Northeast growing more slowly (+22.9% and +9.1%, respectively). Active listings in the west are approaching pre-pandemic 2019 levels (-7.3% below), while other regions are still well below this benchmark (-40.9% in the Midwest, -38.7% in the Northeast, and -27.8% in the South). In November, no regions saw new listing activity above the previous year. The South saw newly listed homes decline least, by 14.6% compared to the previous year, while they declined by 25.8% in the West, 20.2% in the Northeast, and 18.8% in the Midwest.
Inventory increased in 47 out of 50 of the largest metros compared to last year. Metros which saw the most inventory growth include Raleigh (+188.2%), Nashville (+182.8%), and Phoenix (+176.0%). Inventory is still declining on a year-over-year basis in 3 markets: Hartford (-15.6%), New York (-1.0%), and Chicago (-0.2%).
Only Nashville saw the number of newly listed homes increase compared to last year (+5.1%). Markets which reported large declines in newly listed homes compared to last year included Oklahoma City (-43.3%), Hartford (-35.2), and San Jose (-32.7%).
Home Listings Are Spending More Time on the Market
The typical home spent 56 days on the market this November which is 8 days more than last year. Slower inventory turnover is primarily fueling the growth in actively listed homes but homes still spent 18 fewer days on the market this November than typical 2017 to 2019 timing.
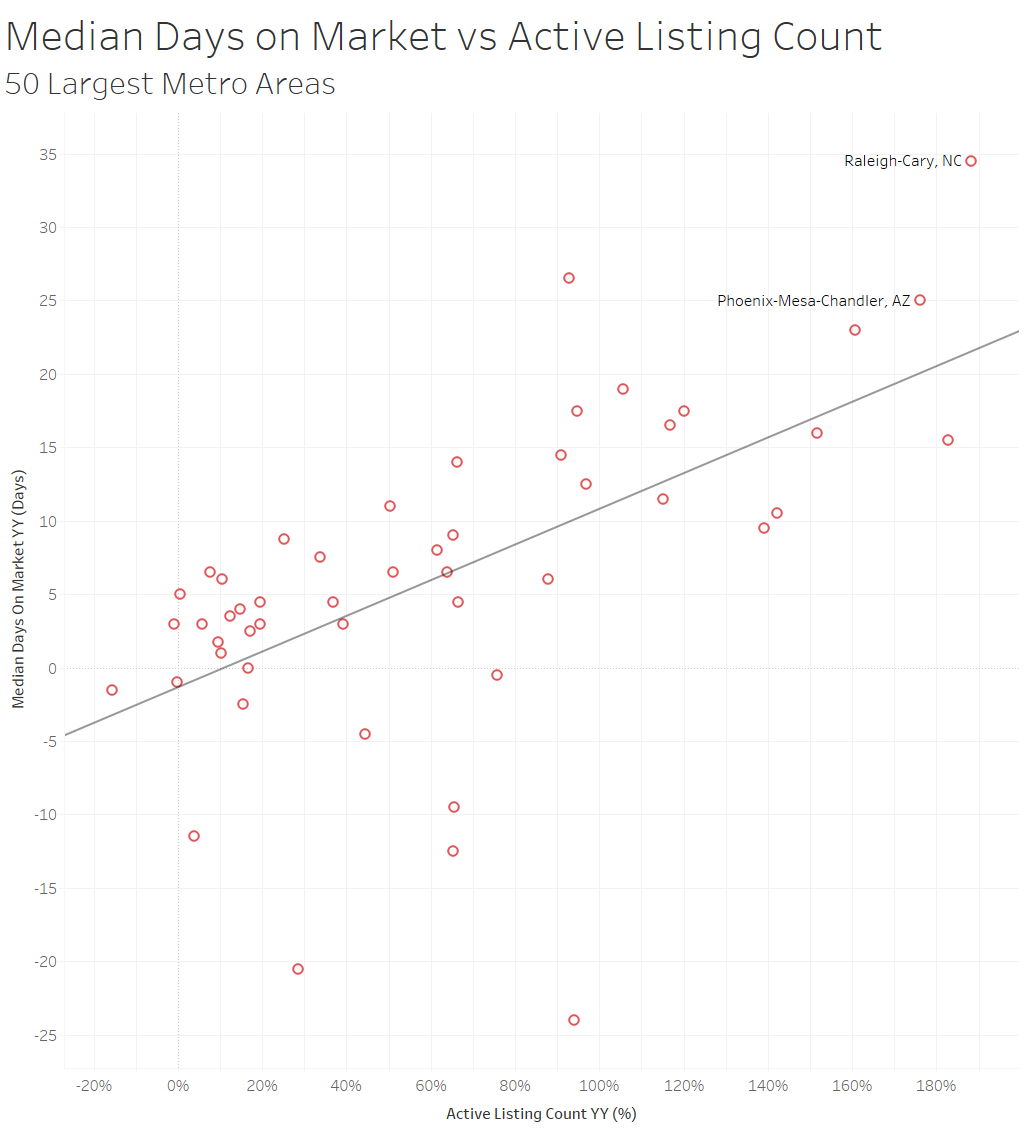
In the 50 largest U.S. metros, the typical home spent 50 days on the market, 6 days more than last November. The time a typical home spends on the market increased across regions, with larger metros in the West seeing the greatest increase (+11 days), followed by the South (+7 days), Northeast (+4 days) and Midwest (+2 days).
Thirty-nine of the 50 largest metros saw time on market increase compared to the previous year. Time on market declined most in New Orleans (-24 days) as last year’s figure was impacted by Hurricane Ida. The other markets where time on market declined included Richmond (-21 days), San Jose (-13 days), and Milwaukee (-12 days). Time on market increased most in the southern and western metros of Raleigh (+35 days), Las Vegas (+27 days), and Phoenix (+25 days).
In general, metros which are seeing the greatest slowdown in time on market are also seeing the largest increases in active inventory, with Raleigh and Phoenix being among the metros with highest growth in both metrics.
Price Growth Continues to Slow but Remains in Double-Digits
The median national list price declined to $416,000 in November, down from an all-time high of $449,000 in June (-7.9%). This represents an annual growth rate of 11.0%, a deceleration from last month’s growth rate of 13.3% and down from a peak growth rate of 18.2% in June. Home prices have typically declined by about 2% from summer’s peak by November, so this year’s price slow-down is larger than the usual seasonal easing.
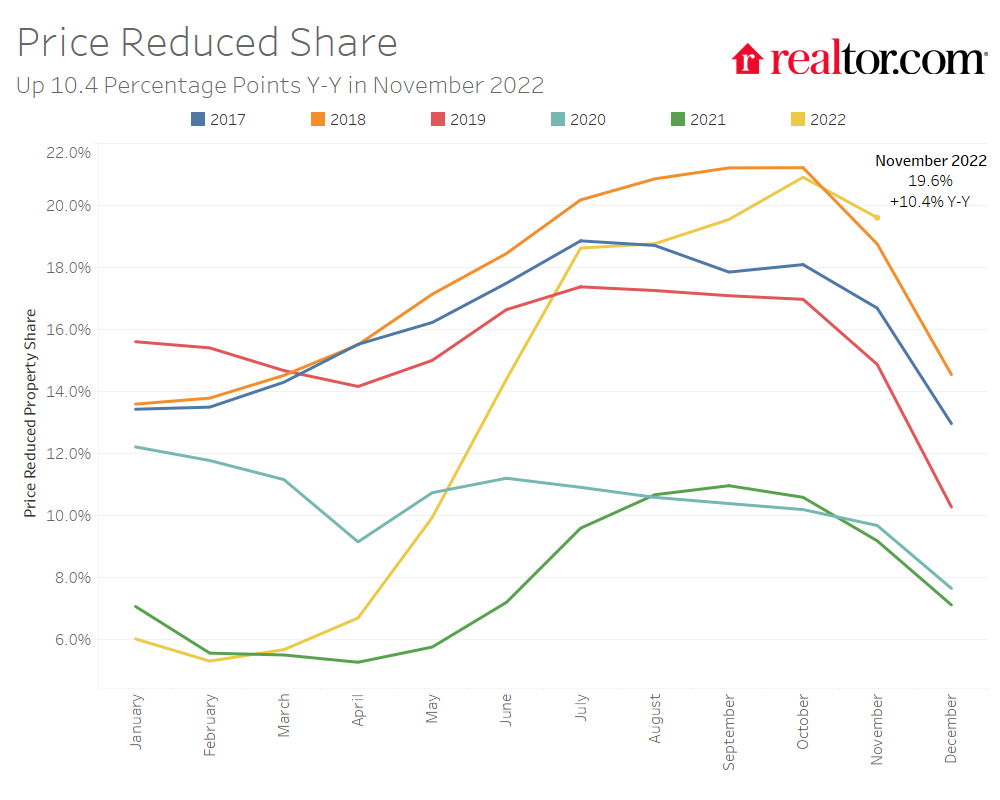
The share of homes having their price reduced grew from 9.2% last November to 19.6% this year. The share is now well above pre-pandemic levels but has peaked seasonally and is below October’s 20.9% share.
Active listing prices in the nation’s largest metros grew by an average of 8.8% compared to last year. Midwestern metros led the charge in active listing price growth, growing by 13.1% on average over the past year. Listing prices in the midwestern and southern metros of Milwaukee (+38.1%), Memphis (+26.9%) and Miami (+24.8%) grew the most among large metros. Western metros saw the greatest increase in the share of price reductions (+15.7 percentage points), followed by southern metros (+13.8 percentage points). Homes in Phoenix (+28.4 percentage points), Austin (+23.8 percentage points), and Denver (+21.0 percentage points) showed the greatest growth in the share of homes with price reductions compared to last year.
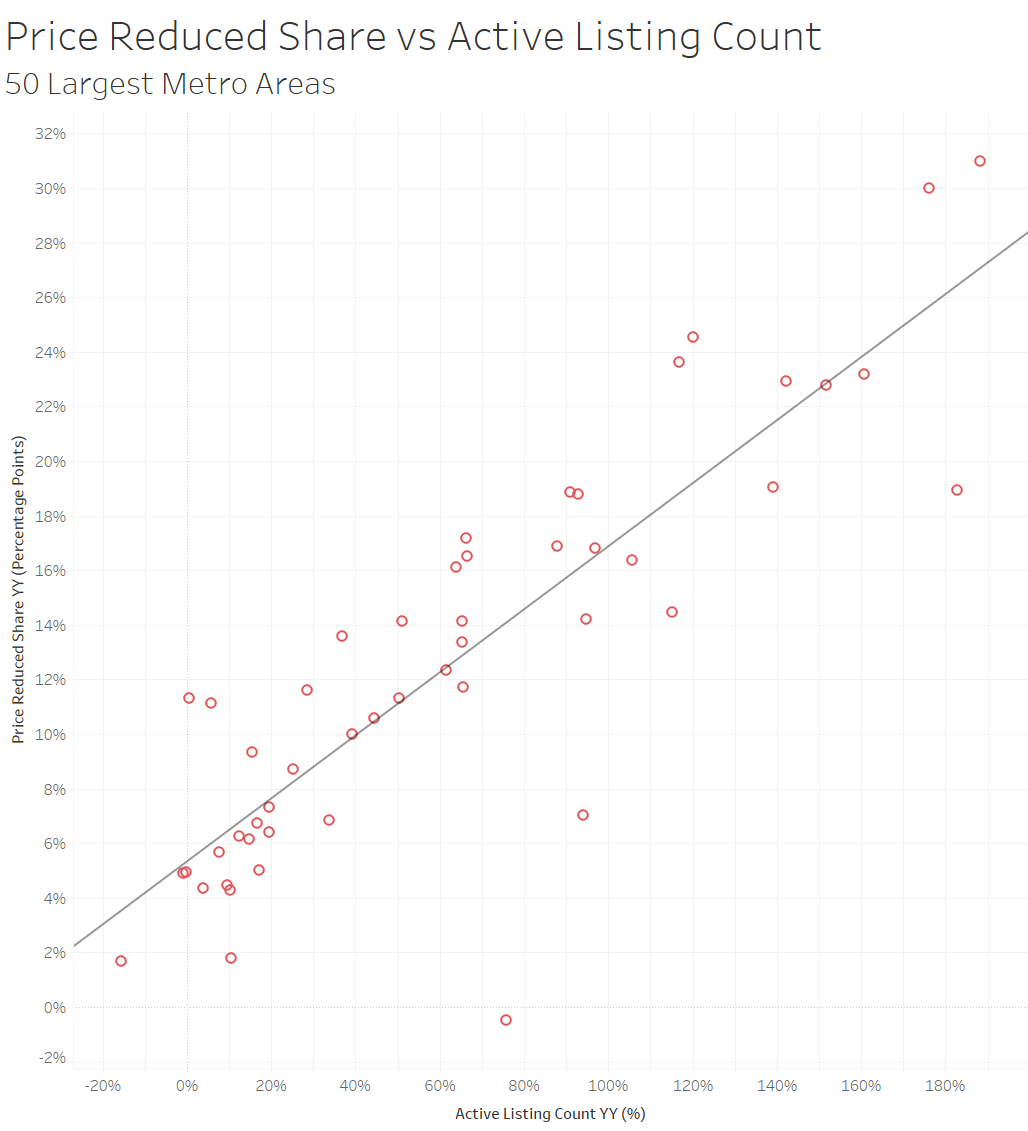
Increases in inventory drove price reductions in November as supply is starting to outpace demand. Of the 50 largest metro areas, the metros with larger increases in active inventory also saw the highest growth in the share of price reductions over the past year.
November 2022 Regional Statistics (50 Largest Metro Combined Average)
| Region | Active Listing Count YoY | New Listing Count YoY | Median Listing Price YoY | Median Listing Price Per SF YoY | Median Days on Market Y-Y (Days) | Price Reduced Share Y-Y (Percentage Points) |
| Midwest | 22.9% | -18.8% | 13.1% | 7.2% | +2 days | 8.0 pp |
| Northeast | 9.1% | -20.2% | 9.4% | 4.6% | +4 days | 4.6 pp |
| South | 89.3% | -14.6% | 9.0% | 7.0% | +7 days | 13.8 pp |
| West | 93.7% | -25.8% | 3.8% | 3.5% | +11 days | 15.7 pp |
November 2022 Housing Overview by Top 50 Largest Metros
| Metro | Median Listing Price | Median Listing Price YoY | Median Listing Price per Sq. Ft. YoY | Active Listing Count YoY | New Listing Count YoY | Median Days on Market | Median Days on Market Y-Y (Days) | Price Reduced Share | Price Reduced Share Y-Y (Percentage Points) |
| Atlanta-Sandy Springs-Roswell, Ga. | $402,000 | 1.8% | 4.1% | 64.0% | -18.9% | 51 | 7 | 22.5% | 14.7 pp |
| Austin-Round Rock, Texas | $531,000 | -3.4% | -0.2% | 160.7% | -9.9% | 61 | 23 | 36.5% | 23.8 pp |
| Baltimore-Columbia-Towson, Md. | $339,000 | 7.8% | 4.9% | 9.4% | -22.8% | 45 | 2 | 17.8% | 5.4 pp |
| Birmingham-Hoover, Ala. | $277,000 | -1.1% | 4.9% | 65.6% | -14.0% | 53 | -10 | 18.1% | 11 pp |
| Boston-Cambridge-Newton, Mass.-N.H. | $740,000 | 10.1% | 2.7% | 19.5% | -20.3% | 43 | 5 | 20.2% | 7.4 pp |
| Buffalo-Cheektowaga-Niagara Falls, N.Y. | $240,000 | 10.3% | 7.6% | 17.0% | -20.8% | 53 | 3 | 8.9% | 3.5 pp |
| Charlotte-Concord-Gastonia, N.C.-S.C. | $401,000 | 1.5% | 8.5% | 91.0% | -24.4% | 48 | 15 | 22.5% | 12.5 pp |
| Chicago-Naperville-Elgin, Ill.-Ind.-Wis. | $331,000 | 2.8% | -1.0% | -0.2% | -21.1% | 45 | -1 | 16.1% | 5.4 pp |
| Cincinnati, Ohio-Ky.-Ind. | $325,000 | 8.8% | 5.8% | 10.3% | -18.2% | 42 | 1 | 15.4% | 4.9 pp |
| Cleveland-Elyria, Ohio | $200,000 | 5.3% | 5.2% | 16.7% | -10.4% | 47 | 0 | 18.5% | 6.8 pp |
| Columbus, Ohio | $330,000 | 14.0% | 9.5% | 36.8% | -19.3% | 37 | 5 | 23.0% | 11.8 pp |
| Dallas-Fort Worth-Arlington, Texas | $447,000 | 11.8% | 7.6% | 142.2% | -0.8% | 49 | 11 | 26.6% | 19.5 pp |
| Denver-Aurora-Lakewood, Colo. | $605,000 | -2.0% | -1.5% | 120.1% | -23.4% | 47 | 18 | 30.0% | 21 pp |
| Detroit-Warren-Dearborn, Mich. | $247,000 | 8.6% | 2.9% | 33.7% | -12.6% | 44 | 8 | 23.0% | 7.4 pp |
| Hartford-West Hartford-East Hartford, Conn. | $372,000 | 10.7% | 3.0% | -15.6% | -35.2% | 45 | -2 | 8.8% | 1.4 pp |
| Houston-The Woodlands-Sugar Land, Texas | $363,000 | 0.8% | 3.3% | 44.3% | -8.2% | 52 | -5 | 21.4% | 10.7 pp |
| Indianapolis-Carmel-Anderson, Ind. | $295,000 | 9.6% | 10.7% | 66.4% | -19.5% | 46 | 5 | 24.0% | 13.3 pp |
| Jacksonville, Fla. | $398,000 | 10.4% | 9.2% | 116.8% | -11.9% | 60 | 17 | 27.1% | 19.3 pp |
| Kansas City, Mo.-Kan. | $400,000 | 21.2% | 10.4% | 50.4% | -24.9% | 63 | 11 | 17.5% | 10.1 pp |
| Las Vegas-Henderson-Paradise, Nev. | $449,000 | -0.2% | 5.4% | 92.9% | -17.0% | 63 | 27 | 31.3% | 18.8 pp |
| Los Angeles-Long Beach-Anaheim, Calif. | $934,000 | 2.6% | 3.3% | 61.6% | -23.5% | 52 | 8 | 17.6% | 11.4 pp |
| Louisville/Jefferson County, Ky.-Ind. | $290,000 | 16.0% | 5.5% | 25.1% | -14.1% | 41 | 9 | 21.1% | 8.6 pp |
| Memphis, Tenn.-Miss.-Ark. | $325,000 | 26.9% | 16.2% | 115.0% | -7.5% | 50 | 12 | 20.6% | 13.5 pp |
| Miami-Fort Lauderdale-West Palm Beach, Fla. | $599,000 | 24.8% | 11.7% | 39.2% | -8.0% | 64 | 3 | 15.8% | 9.5 pp |
| Milwaukee-Waukesha-West Allis, Wis. | $368,000 | 38.1% | 16.7% | 3.9% | -16.6% | 40 | -12 | 16.8% | 5.1 pp |
| Minneapolis-St. Paul-Bloomington, Minn.-Wis. | $400,000 | 14.3% | 6.6% | 5.7% | -26.6% | 46 | 3 | 18.7% | 9.2 pp |
| Nashville-Davidson–Murfreesboro–Franklin, Tenn. | $524,000 | 14.0% | 8.1% | 182.8% | 5.1% | 38 | 16 | 26.9% | 18.1 pp |
| New Orleans-Metairie, La. | $327,000 | -5.4% | -3.9% | 93.9% | -8.3% | 64 | -24 | 20.6% | 9.6 pp |
| New York-Newark-Jersey City, N.Y.-N.J.-Pa. | $669,000 | 8.0% | 7.8% | -1.0% | -19.8% | 66 | 3 | 11.1% | 4 pp |
| Oklahoma City, Okla. | $325,000 | 12.3% | 9.7% | 65.3% | -43.3% | 50 | 9 | 19.7% | 12.1 pp |
| Orlando-Kissimmee-Sanford, Fla. | $439,000 | 14.1% | 13.9% | 105.6% | -16.9% | 62 | 19 | 20.9% | 13.7 pp |
| Philadelphia-Camden-Wilmington, Pa.-N.J.-Del.-Md. | $330,000 | 6.5% | 5.0% | 12.5% | -22.9% | 55 | 4 | 16.9% | 6 pp |
| Phoenix-Mesa-Scottsdale, Ariz. | $477,000 | -1.1% | 4.0% | 176.0% | -27.4% | 58 | 25 | 39.0% | 28.4 pp |
| Pittsburgh, Pa. | $219,000 | 0.1% | 0.1% | 14.8% | -16.4% | 59 | 4 | 19.7% | 6.6 pp |
| Portland-Vancouver-Hillsboro, Ore.-Wash. | $582,000 | 5.9% | 2.7% | 75.7% | -28.1% | 52 | -1 | 22.0% | 6.8 pp |
| Providence-Warwick, R.I.-Mass. | $475,000 | 9.8% | 7.0% | 7.7% | -17.9% | 39 | 7 | 13.5% | 5.4 pp |
| Raleigh, N.C. | $449,000 | 5.7% | 5.2% | 188.2% | -15.8% | 58 | 35 | 26.2% | 18.9 pp |
| Richmond, Va. | $378,000 | 7.9% | 8.3% | 28.4% | -24.9% | 45 | -21 | 13.5% | 8.1 pp |
| Riverside-San Bernardino-Ontario, Calif. | $569,000 | 3.6% | 9.5% | 94.7% | -25.7% | 58 | 18 | 21.6% | 14 pp |
| Rochester, N.Y. | $226,000 | 13.0% | 9.9% | 10.4% | -8.4% | 31 | 6 | 11.7% | 1.9 pp |
| Sacramento–Roseville–Arden-Arcade, Calif. | $590,000 | -0.4% | -0.3% | 66.3% | -31.9% | 51 | 14 | 26.6% | 16.4 pp |
| San Antonio-New Braunfels, Texas | $350,000 | 5.6% | 5.1% | 96.8% | -17.4% | 58 | 13 | 24.1% | 15.7 pp |
| San Diego-Carlsbad, Calif. | $884,000 | 6.4% | 6.4% | 87.7% | -25.8% | 44 | 6 | 21.9% | 15.3 pp |
| San Francisco-Oakland-Hayward, Calif. | $1,035,000 | 5.2% | -0.6% | 51.0% | -26.3% | 46 | 7 | 18.6% | 12.4 pp |
| San Jose-Sunnyvale-Santa Clara, Calif. | $1,399,000 | 12.4% | 4.8% | 65.3% | -32.7% | 41 | -13 | 15.0% | 11.5 pp |
| Seattle-Tacoma-Bellevue, Wash. | $737,000 | 9.3% | 5.0% | 139.2% | -22.5% | 46 | 10 | 22.4% | 16.6 pp |
| St. Louis, Mo.-Ill. | $273,000 | 15.2% | 7.8% | 15.5% | -15.1% | 44 | -3 | 16.8% | 7.7 pp |
| Tampa-St. Petersburg-Clearwater, Fla. | $415,000 | 8.8% | 8.5% | 151.6% | -3.1% | 54 | 16 | 29.2% | 20.2 pp |
| Virginia Beach-Norfolk-Newport News, Va.-N.C. | $359,000 | 19.8% | 8.9% | 0.4% | -26.2% | 40 | 5 | 20.3% | 11.3 pp |
| Washington-Arlington-Alexandria, DC-Va.-Md.-W. Va. | $565,000 | 13.0% | -1.6% | 19.6% | -22.7% | 44 | 3 | 17.0% | 6.6 pp |
Note: With the release of its September 2022 housing trends report, Realtor.com® incorporated a new and improved methodology for capturing and reporting housing inventory trends and metrics. The new methodology updates and improves the calculation of time on market and improves handling of duplicate listings. Most areas across the country will see minor changes with a smaller handful of areas seeing larger updates. As a result of these changes, the data released since October 2022 will not be directly comparable with previous data releases (files downloaded before October 2022) and Realtor.com® economics blog posts. However, future data releases, including historical data, will consistently apply the new methodology.
Subscribe to our mailing list to receive updates and notifications on the latest data and research.
![]()
![]() Sabrina Speianu,
Sabrina Speianu, ![]()
![]() Danielle Hale
Danielle Hale


