How Flood Risks Impact Home Values in South Florida
Note: Bin He and Rajendra Anjanappa, both from CoreLogic’s Science and Analytics team, contributed to this post
In recent years, climate-related hazards have emerged as crucial factors that influence home values. However, the true impact of these risks on property prices remains concealed within their inherent value.
With the rise in the frequency of natural disasters, it is essential for lenders and insurance companies to accurately assess and quantify the risks associated with flooding in order to determine the costs involved. In this study, CoreLogic’s data science team will quantify the impact of Federal Emergency Management Agency (FEMA) flood zones on home prices by using regression analysis, while controlling for non-climate risk factors.
The Magnitude of Flood Risks in South Florida
Nearly 40% of total U.S. residents live in coastal regions, with Florida ranking among the top five states in terms of coastal population. Miami-Dade County stands out, being the seventh-most populated county in the U.S. A study,[1] [2] indicates that approximately 41 million U.S. residents face the risk of flooding along rivers and streams, while 8.6 million individuals live in coastal areas with at least a 1% chance of flooding in any given year. If the current sea level rises by two feet, more than $1 trillion of property and structures are at risk, and roughly 50% of that vulnerable property value is in Florida[3].
Defining Flood Zones and the Effect on Home Sales in South Florida
For this analysis, we examined residential sales data from the first quarter of 2011 to the second quarter of 2022 in Miami-Dade County. The sales data is sourced from CoreLogic, while flood-zone information was obtained from FEMA. By employing a spatial join in QGIS with FEMA’s flood-one shape files, CoreLogic assigned each property to a respective flood zone. This analysis uses a standard data-cleansing process, excluding flip sales and outlying transactions of explanatory variables.
Flood zones in Miami-Dade County are defined as such:
- Zone X: An area that is determined to be outside the 100- and 500-year floodplains
- Zone X500 (Moderate flood risk): There is less than a 0.2% chance of annual flooding, or a 1 in 500 chance, which makes it one of the safest flood zones.
- Zone A (High flood risk): Because detailed analyses are not performed for such areas, no depths or base flood elevations are shown within these zones. In these areas, there is at least a 25% chance of flooding during a 30-year mortgage.
- Zone AE (Moderate-to-high flood risk): This is the flood zone area that corresponds with flood depths greater than three feet.
- Zone AH (Moderate-to-high flood risk): Areas with a 1% annual chance of shallow flooding, usually ponding, with an average depth ranging from one to three feet. These areas have a 26% chance of flooding over the life of a 30‐year mortgage.
- Zone VE (High flood risk): This is the flood zone area that corresponds to coastal areas that have additional hazards associated with storm waves. In these areas, there is at least a 25% chance of flooding during the span of a 30-year mortgage.
Figure 1 shows the median price per square foot for each flood zone. It becomes apparent that coastal zones (VE) consistently command higher prices compared with other zones, with values that reached as high as $475 per square foot in 2022. Zone A properties, on the other hand, have the lowest prices, although their count is relatively small, with fewer than 50 properties in a given year. There is minimal price differences between properties in the X and X500 zones. Within the inland flood zones (AE and AH), there is a significant disparity in the median price per square foot. At first glance, it appears that high flood risk translates to elevated home prices, which is counterintuitive.
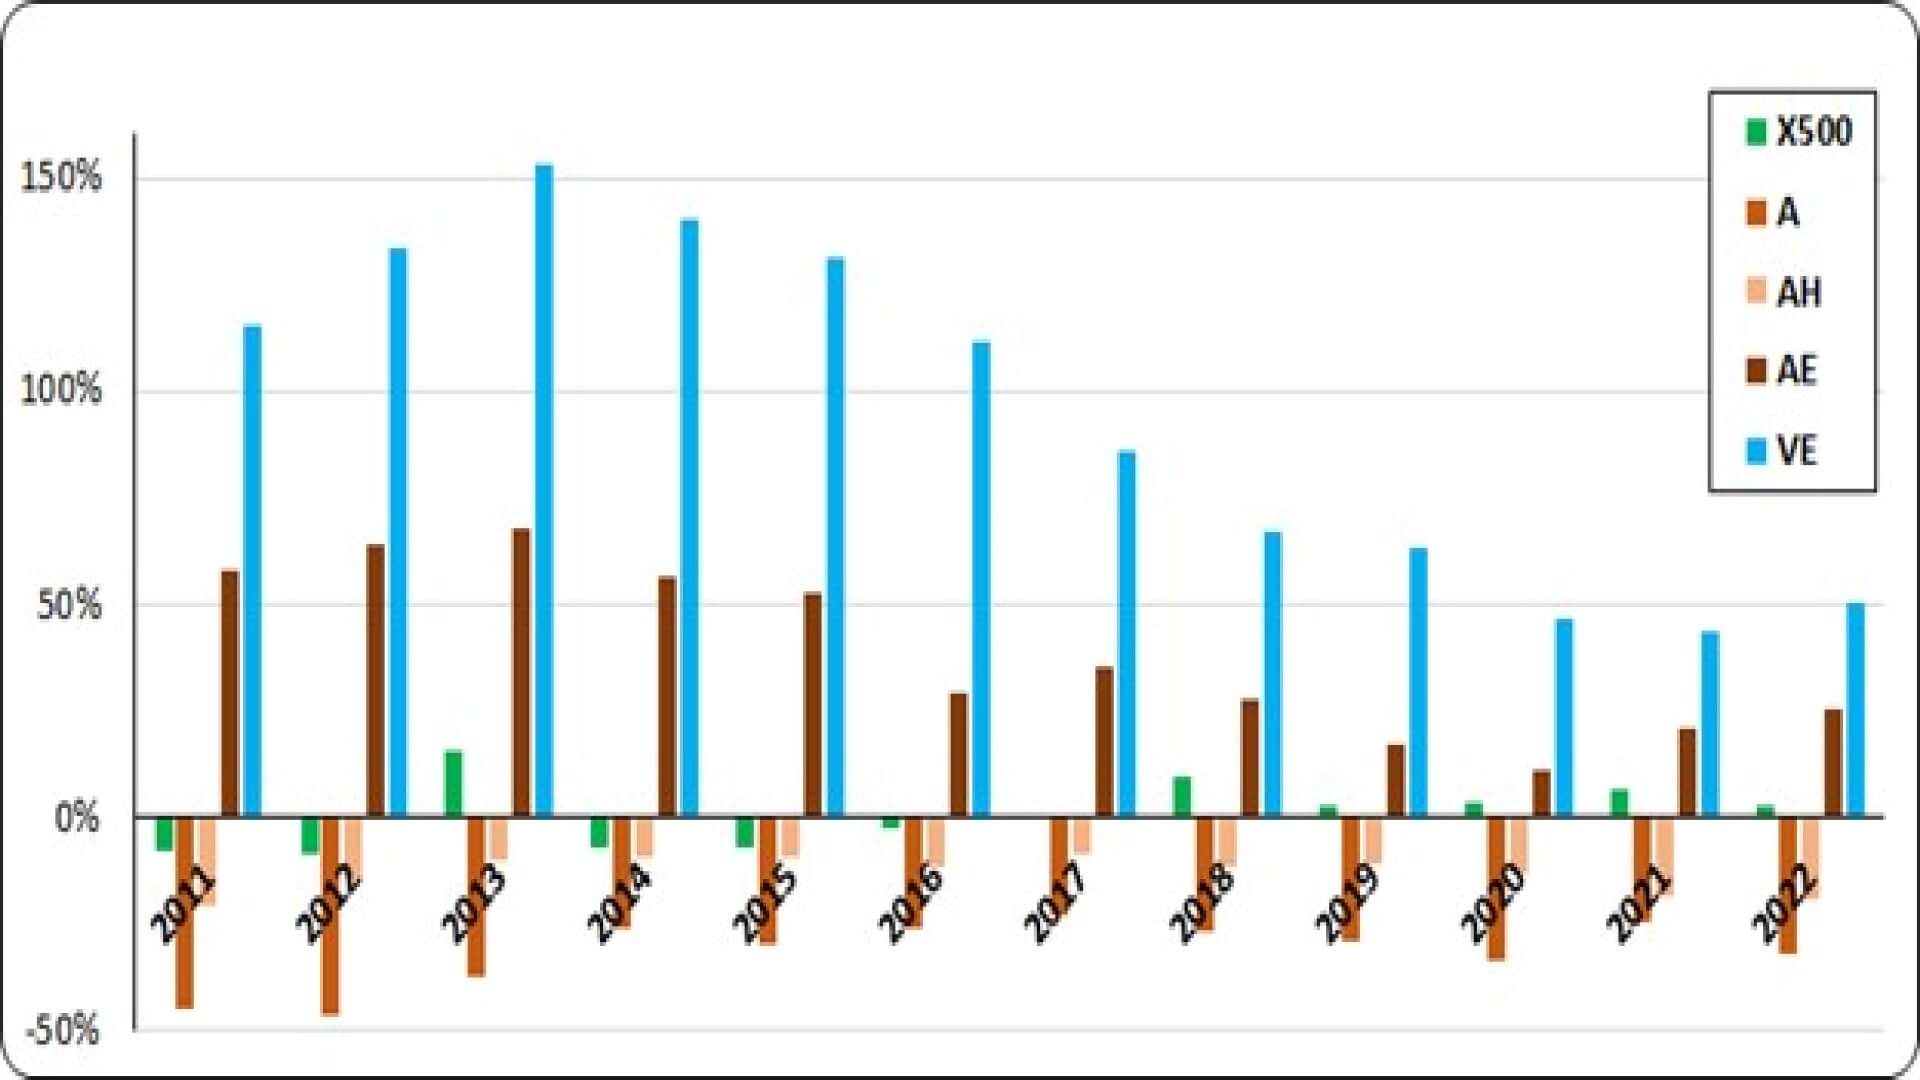
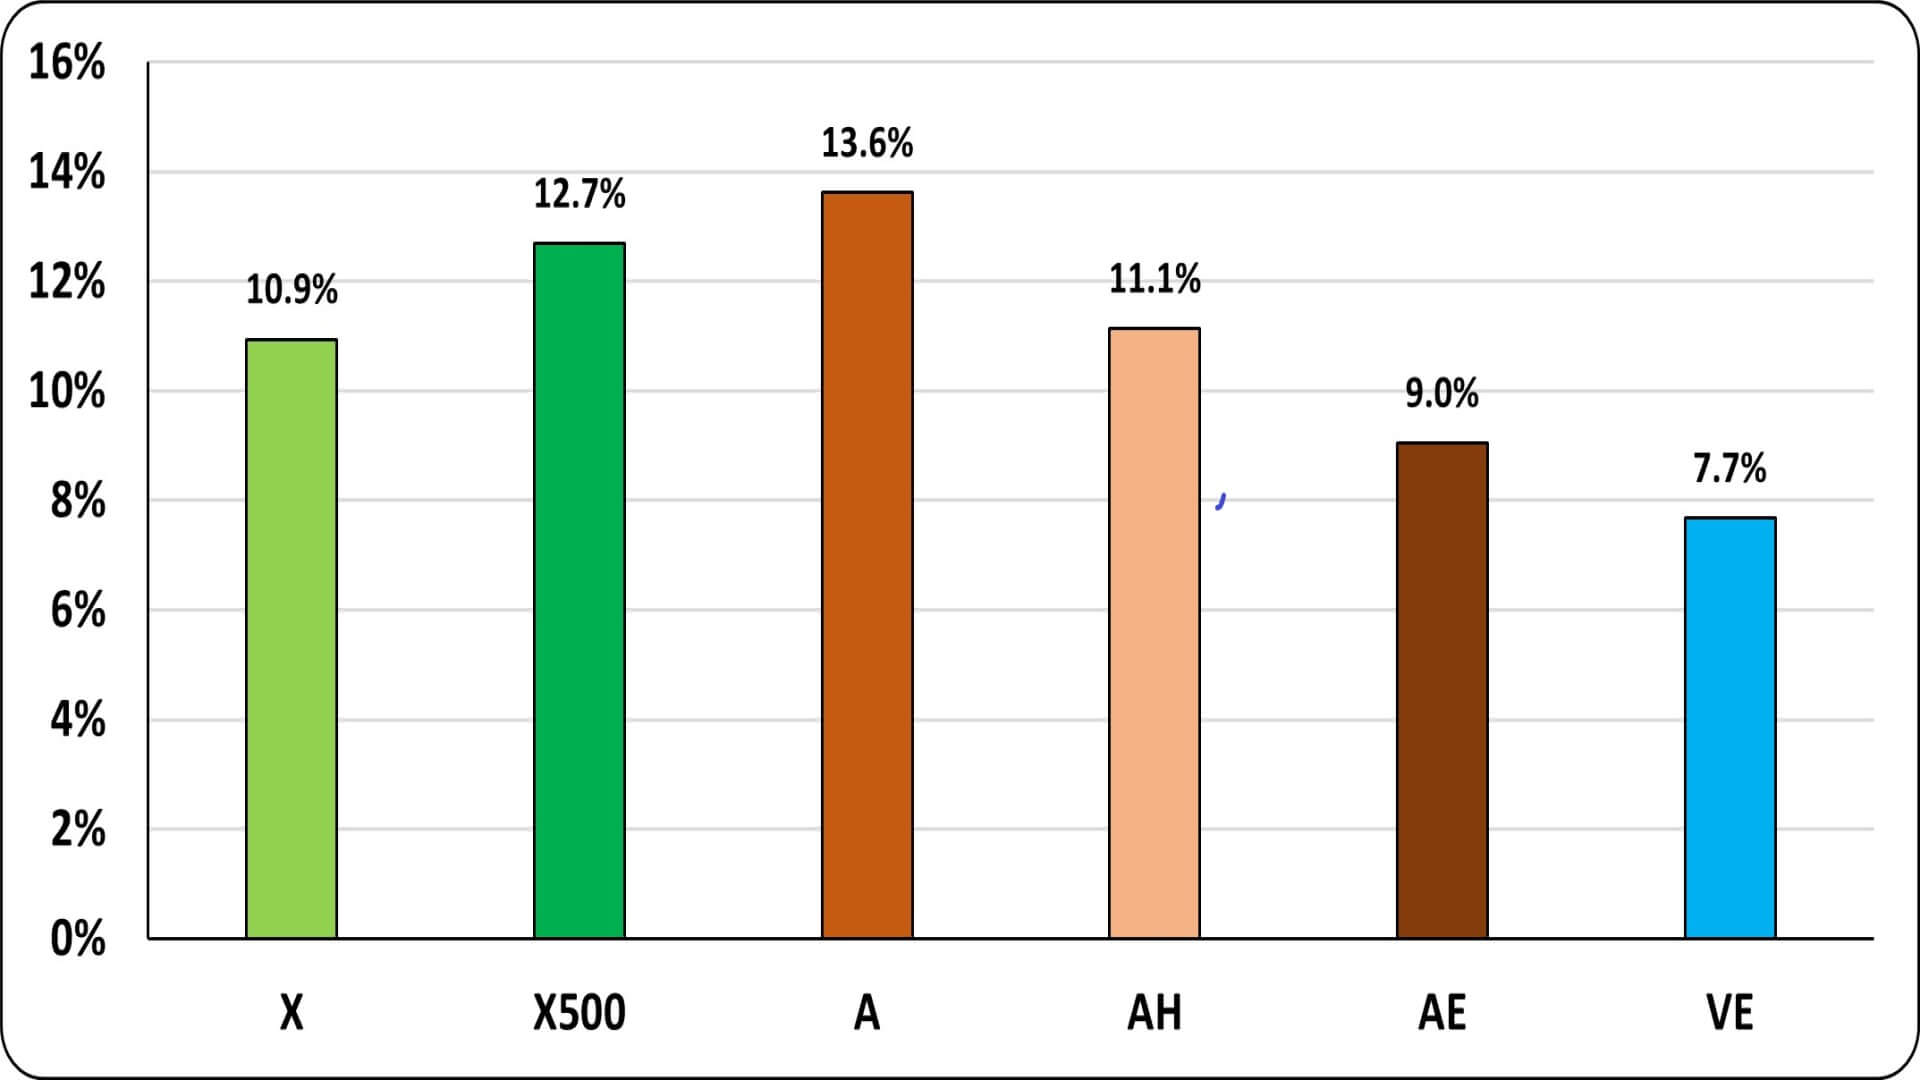
Figure 2 illustrates the price premium or discount of properties compared with Zone X, which represents areas outside of FEMA’s 100-year and 500-year flood zones. Throughout the years, we observe a price premium for zones VE and AE, while zones A and AH show price discounts. Since 2013, coastal property premiums have been declining, mainly due to higher price growth rates in Zone X, as depicted in Figure 3. Consequently, determining the impact of flood risk on home prices becomes challenging.


Regression Analysis Modeling Explained
Assessing home prices requires considering of various factors, including location, neighborhood, property attributes and associated risks.
From this perspective, it becomes apparent that discerning the exact impact of flood risk is complex due to the many factors at play. To accurately understand the impact of flood zones on prices, isolating the flood-risk component from the overall price is crucial. We employed Iterative Weighted Least Square regression model, which controls for property characteristics (such as elevation, number of bathrooms, distance to the coast, property age and condition); market dynamics (days on market and months’ supply of home inventory) and economic risk factors, such as the U.S. unemployment rate. The regression analysis reveals that property prices in coastal areas are discounted by 18%, followed by 4.5% and 9.8% in AH and AE flood zones, respectively, compared with flood Zone X (see Table 1).

By accounting for non-climate factors and isolating the true impact of climate risks, these risks indeed affect property prices, which are evident in the form of discounts. Given the projected increase in climate hazards, with an average of seven or eight events per year and an expected escalation in severity, it becomes crucial for lenders and insurers to adapt differential costs based on these risks.
Take, for instance, August’s Hurricane Hilary, the first such storm to make landfall in Southern California in 84 years. This unprecedented event left a trail of destruction, revealing a significant vulnerability in the region’s housing market. Many homes situated in Hilary’s trajectory were not covered by any standard flood insurance, which left homeowners financially exposed to damage. The aftermath of Hilary serves as a stark reminder of the potential consequences, particularly for lenders, borrowers and insurers who may have previously underestimated climate risks during loan and insurance underwriting.
Keep up with the latest insights from CoreLogic’s data science and climate change experts on our Intelligence home page.
[1] Oliver E J Wing et al. Estimates of present and future flood risk in the conterminous United States , Environ. Res. Lett. 13 034023, (2018) .
[2]
[3] Moser, S.C., et al. Ch. 25: Coastal Zone Development and Ecosystems. Climate Change Impacts in the United States: The Third National Climate Assessment. (2014)
© 2023 CoreLogic,Inc., All rights reserved.


